
Quarterly Business Update Q4 2023 Please see Legal Notices at the end of this report for explanation of Forward-Looking Statements and important cautions.
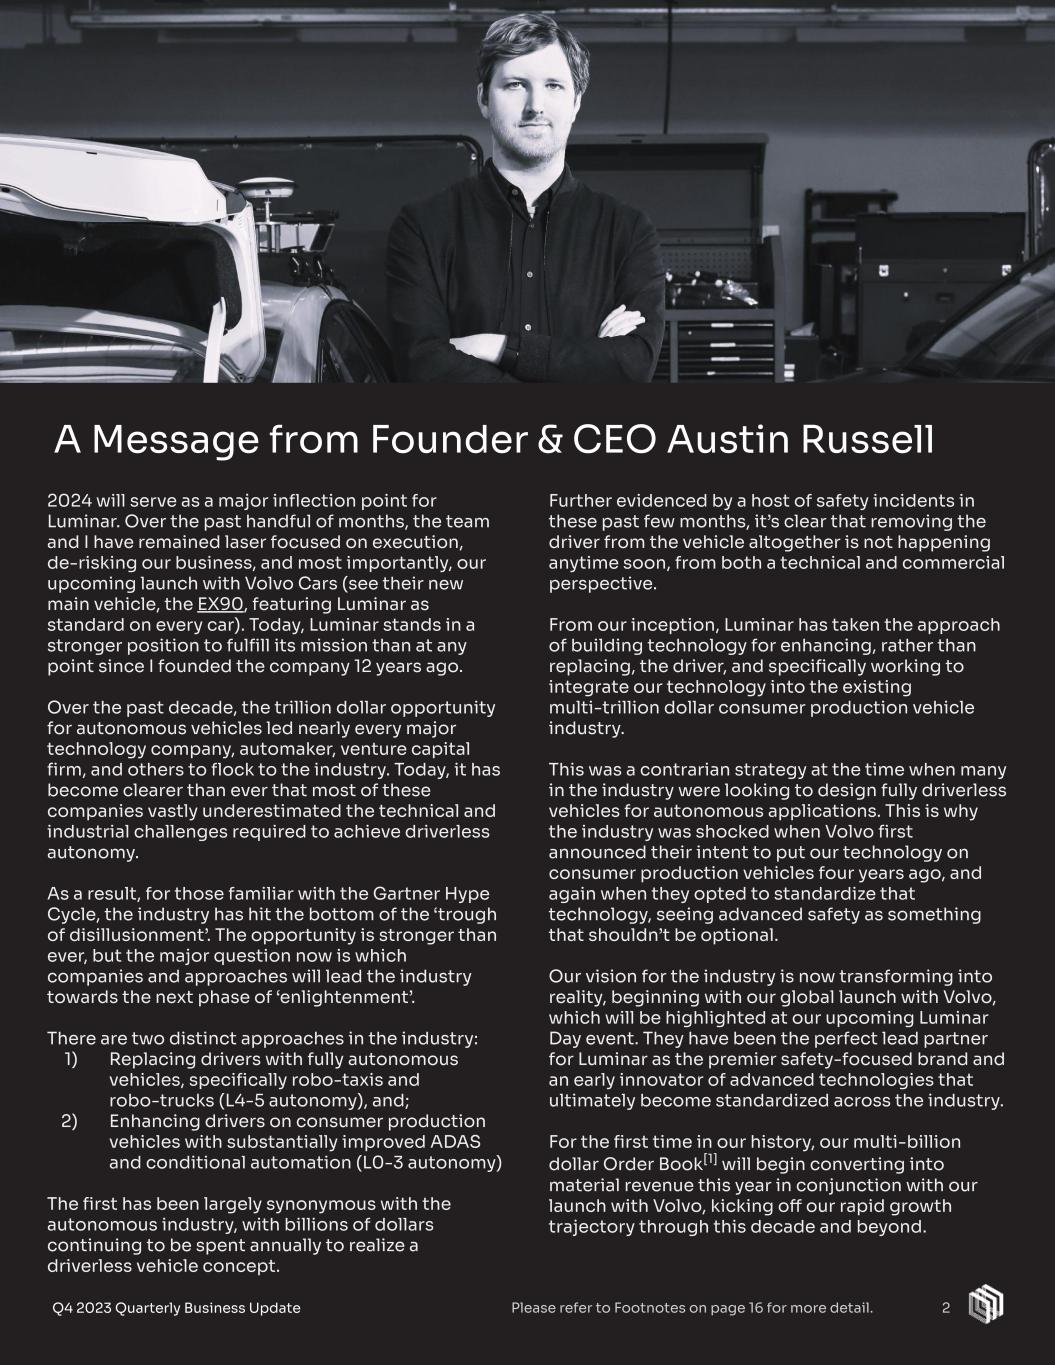
A Message from Founder & CEO Austin Russell 2Please refer to Footnotes on page 16 for more detail. Q4 2023 Quarterly Business Update 2024 will serve as a major inflection point for Luminar. Over the past handful of months, the team and I have remained laser focused on execution, de-risking our business, and most importantly, our upcoming launch with Volvo Cars (see their new main vehicle, the EX90, featuring Luminar as standard on every car). Today, Luminar stands in a stronger position to fulfill its mission than at any point since I founded the company 12 years ago. Over the past decade, the trillion dollar opportunity for autonomous vehicles led nearly every major technology company, automaker, venture capital firm, and others to flock to the industry. Today, it has become clearer than ever that most of these companies vastly underestimated the technical and industrial challenges required to achieve driverless autonomy. As a result, for those familiar with the Gartner Hype Cycle, the industry has hit the bottom of the ‘trough of disillusionment’. The opportunity is stronger than ever, but the major question now is which companies and approaches will lead the industry towards the next phase of ‘enlightenment’. There are two distinct approaches in the industry: 1) Replacing drivers with fully autonomous vehicles, specifically robo-taxis and robo-trucks (L4-5 autonomy), and; 2) Enhancing drivers on consumer production vehicles with substantially improved ADAS and conditional automation (L0-3 autonomy) The first has been largely synonymous with the autonomous industry, with billions of dollars continuing to be spent annually to realize a driverless vehicle concept. Further evidenced by a host of safety incidents in these past few months, it’s clear that removing the driver from the vehicle altogether is not happening anytime soon, from both a technical and commercial perspective. From our inception, Luminar has taken the approach of building technology for enhancing, rather than replacing, the driver, and specifically working to integrate our technology into the existing multi-trillion dollar consumer production vehicle industry. This was a contrarian strategy at the time when many in the industry were looking to design fully driverless vehicles for autonomous applications. This is why the industry was shocked when Volvo first announced their intent to put our technology on consumer production vehicles four years ago, and again when they opted to standardize that technology, seeing advanced safety as something that shouldn’t be optional. Our vision for the industry is now transforming into reality, beginning with our global launch with Volvo, which will be highlighted at our upcoming Luminar Day event. They have been the perfect lead partner for Luminar as the premier safety-focused brand and an early innovator of advanced technologies that ultimately become standardized across the industry. For the first time in our history, our multi-billion dollar Order Book[1] will begin converting into material revenue this year in conjunction with our launch with Volvo, kicking off our rapid growth trajectory through this decade and beyond.

Q4 2023 Quarterly Business Update 2023 Business Review Luminar achieved the majority of its company-level milestones in 2023, with highlights including: 1) Industrializing for OEM Requirements & Scale We successfully brought our Iris sensor through the validation phases to Western automotive grade standards, while executing the build out and bring up of the high volume manufacturing facility in Mexico with Celestica, as well as our optical sub-assembly facility in Thailand with Fabrinet. These efforts culminated in passing Volvo Cars’ initial Run at Rate production audit towards the end of last year, and the facility has begun delivering product to customers. In parallel, we also executed on Iris+ development, delivering samples to our lead customers through the year, and more recently showcasing its performance at CES. This year we also partnered with TPK to support our industrialization efforts in Asia and beyond, while also helping to reduce costs. 2) Expanding our Commercial Wins In 2023, we successfully expanded our commercial relationships across the board after proving our execution. 2023 Headwind to 2024 Tailwind While we’re proud of all we achieved throughout 2023, the principal headwind we faced was the pushout of the EX90 into 2024. As a result, we did not record material production revenue for Volvo Cars this year and incurred incremental launch[2] costs. Although negligible in the context of the broader investment we have made to date, it disproportionately affects near-term financials given we were in pre-launch stage. Nevertheless, we did successfully improve our Q4 change in cash by ~50% relative to Q1. Despite no material revenue from Volvo, remarkably Luminar still achieved the substantial majority of our revenue target pre-launch, representing 71% YoY growth in FY’23 and nearly 100% YoY growth in Q4’23. Driving this was increased revenue and successful expansion of our ecosystem through our LiDAR semiconductors, the Luminar AI Engine with data, in addition to OEM production vehicle integration services (NRE). It is important to note that successfully delivering our technology and product to the industry is how we will realize billions of dollars in value, and pre-launch financial metrics are not a meaningful indicator of our business value or performance. That being said, that dynamic will begin to change later this year, as this headwind evolves into a tailwind and Order Book[1] begins materially converting into revenue. 3Please refer to Footnotes on page 16 for more detail.
2023 Business Review (continued) We’ve expanded our relationship with traditional automakers, and in particular from a single Mercedes-Benz vehicle model to a host of vehicles across their next-generation lineup, and in conjunction, we introduced Iris+. At the same time, we also expanded with new OEMs such as Polestar, who expanded our partnership to multiple vehicle models after successful collaboration on the Polestar 3. WIth respect to technology partners, our collaboration with NVIDIA has evolved from reference platform to production platform. Our partnership with Mobileye has also advanced to the production stage for its Chauffeur platform and our first joint vehicle win. 3) Quality over Quantity While we’re excited by the prospect of working with additional automotive partners as we scale, it’s critical to understand where the value opportunity lies - in our execution. For example, an incremental expansion from one of our current automakers slated for production can at times mean more volume than a dozen new automakers combined. The numbers are surprisingly large. Our current nearly $4 billion Order Book[1] represents only ~10% of the volume for our series production customers (and that’s not even including Nissan). Proving ourselves through successful execution with the LiDAR alone can enable an order of magnitude of growth beyond that within our customer base, and can be multiplied further with software[3] and insurance. 4Q4 2023 Quarterly Business Update If it wasn’t clear, our biggest growth and value lever over the coming years isn’t necessarily winning additional customers; it’s just continuing to execute. This is why, at this stage, we’ve been very selective about the business opportunities and partnerships we take on. Specifically, starting late last year, I have directed our team to focus in on programs driving material value, and de-prioritize or walk away from robo-taxi and robo-truck opportunities that would require material investment or precious resources. 4) Continuing to Build the LiDAR Ecosystem In 2023, we launched the Luminar AI Engine, and partnered with Scale AI and Plus for their data processing and software capabilities, respectively. We’ve also furthered our LiDAR semiconductor technologies, which included producing six new types of chips to enhance performance and lower cost. Other industries have also begun making use of these chips in target applications ranging from imaging to GPU interconnects. From a software[3] perspective, we met our core deliverables to our lead series production OEMs for their respective programs. We also showcased some of our more advanced in-development Proactive SafetyTM capabilities at CES, including LiDAR-enabled Automatic Emergency Steering. While much of our growth will come from our LiDAR in series production, our ecosystem beyond the LiDAR itself is no longer theoretical. Today, it represents a double digit percentage of revenue. 4Please refer to Footnotes on page 16 for more detail.
The results of this study has the opportunity to drive down the cost of insurance in partnership with Swiss Re, accelerating mainstream adoption of the technology. 4) Improved Operational & Financial Efficiency 2024 will also mark an inflection point for Luminar in terms of operational and financial efficiency, which will be driven by both passive and active factors. Specifically, we have already made the necessary $1 billion investment in our technology, manufacturing, and infrastructure, and will begin to ride the economic tailwinds from this investment for the first time this year. Additionally, we are also actively driving down cost and leveraging key partners to further enhance our operational and economic efficiency using a more capital light model. 5) Consumer Awareness of Luminar This is the year that Luminar is introduced to the general public. Whereas nearly all automotive products and technologies are white-labeled, many of our automaker partners are doing the opposite and are actively marketing our technology and the functionalities enabled as a core pillar of their brands and products. With tens and then hundreds of thousands of Volvo cars with Luminar out on public roads, visibility of Luminar will scale exponentially. Prior to production, Mercedes is also already actively marketing our technology in conjunction with the Official FIA Mercedes F1 Safety Car, which will provide exposure to a global audience of millions of automotive enthusiasts. 1) Volvo Cars’ Launch with Luminar After spending the last few years industrializing our technology for launch, I’ve never looked forward more to any event for our company. This will also be a critical proof point for the industry, our company, our Order Book[1], and will also change the dialogue with many of the risk-averse automakers, not to mention discussions with insurers, regulators, and even suppliers. We will cover this at the upcoming Luminar Day. 2) Next-Generation Tech & Product Launches For the past five years, we have been quietly developing the technology to power our next-generation LiDAR beyond the Iris family, and will be showcasing it at the upcoming Luminar Day. We’ve achieved a step function improvement across performance, safety, form factor, design, and cost basis, enabled by our next-generation semiconductors and architectural innovations. This is something I’m proud to also be personally involved in helping to architect. 3) Validating the Safety Case Garnering credibility around the safety and performance benefits of our technology will help accelerate industry adoption and standardization. In particular, a number of automakers and industry players are looking forward to seeing the release of a comprehensive safety report this year conducted by top third-party testing firms. This will cover both the state of ADAS on leading vehicles today, as well as the safety improvement opportunity with Luminar-equipped vehicles. 5Q4 2023 Quarterly Business Update 5 A Look Ahead to 2024: Sharing 5 Key Catalysts Please refer to Footnotes on page 16 for more detail.
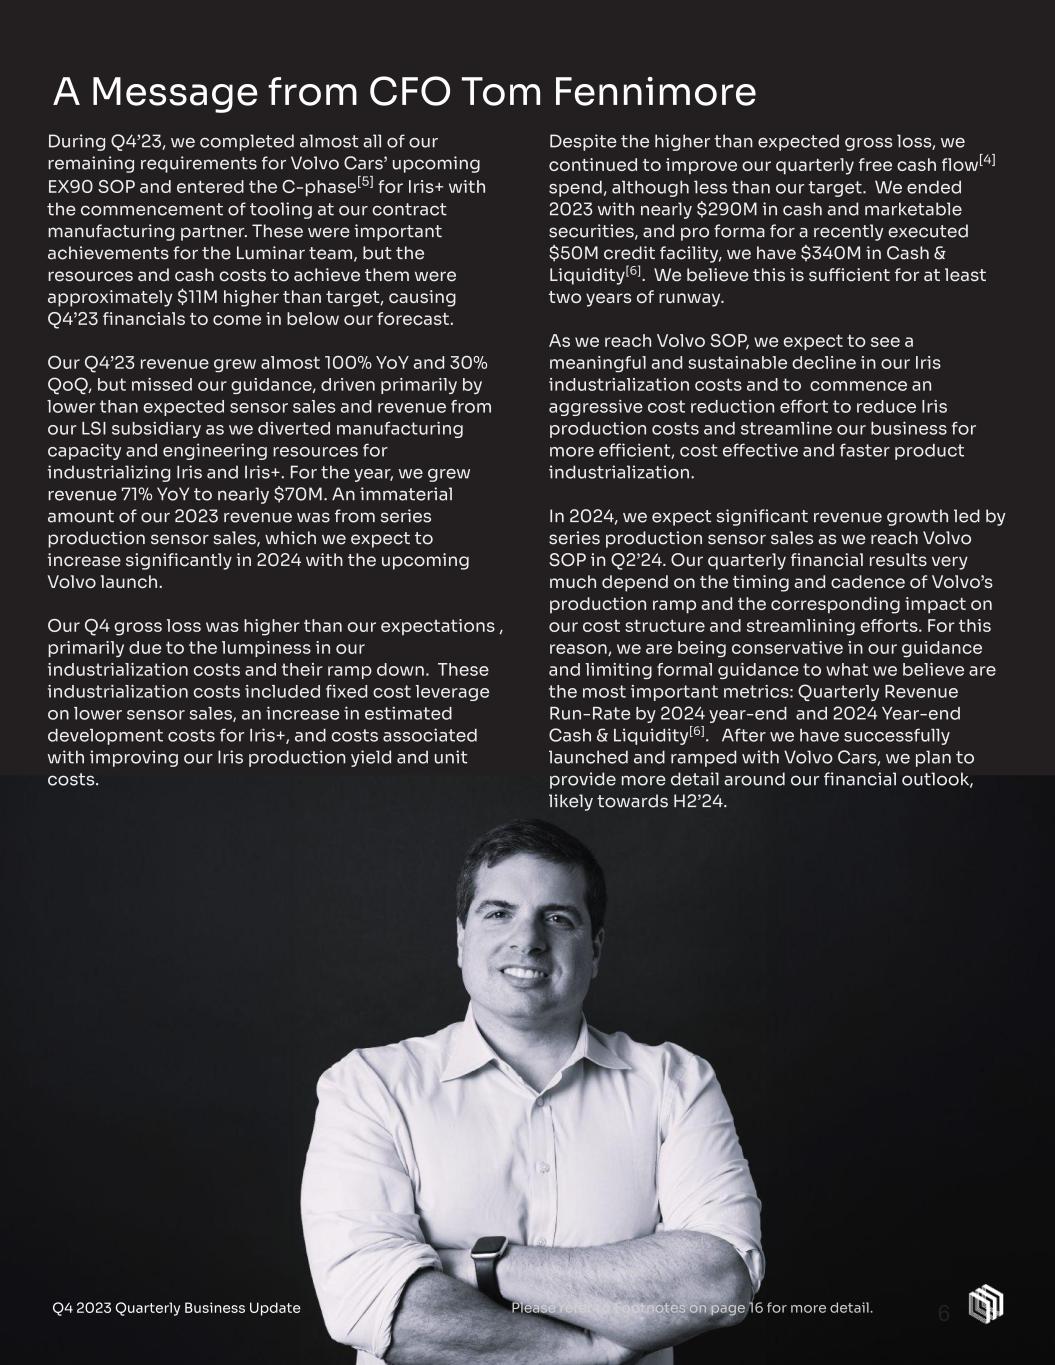
6 A Message from CFO Tom Fennimore Despite the higher than expected gross loss, we continued to improve our quarterly free cash flow[4] spend, although less than our target. We ended 2023 with nearly $290M in cash and marketable securities, and pro forma for a recently executed $50M credit facility, we have $340M in Cash & Liquidity[6]. We believe this is sufficient for at least two years of runway. As we reach Volvo SOP, we expect to see a meaningful and sustainable decline in our Iris industrialization costs and to commence an aggressive cost reduction effort to reduce Iris production costs and streamline our business for more efficient, cost effective and faster product industrialization. In 2024, we expect significant revenue growth led by series production sensor sales as we reach Volvo SOP in Q2’24. Our quarterly financial results very much depend on the timing and cadence of Volvo’s production ramp and the corresponding impact on our cost structure and streamlining efforts. For this reason, we are being conservative in our guidance and limiting formal guidance to what we believe are the most important metrics: Quarterly Revenue Run-Rate by 2024 year-end and 2024 Year-end Cash & Liquidity[6]. After we have successfully launched and ramped with Volvo Cars, we plan to provide more detail around our financial outlook, likely towards H2’24. Q4 2023 Quarterly Business Update During Q4’23, we completed almost all of our remaining requirements for Volvo Cars’ upcoming EX90 SOP and entered the C-phase[5] for Iris+ with the commencement of tooling at our contract manufacturing partner. These were important achievements for the Luminar team, but the resources and cash costs to achieve them were approximately $11M higher than target, causing Q4’23 financials to come in below our forecast. Our Q4’23 revenue grew almost 100% YoY and 30% QoQ, but missed our guidance, driven primarily by lower than expected sensor sales and revenue from our LSI subsidiary as we diverted manufacturing capacity and engineering resources for industrializing Iris and Iris+. For the year, we grew revenue 71% YoY to nearly $70M. An immaterial amount of our 2023 revenue was from series production sensor sales, which we expect to increase significantly in 2024 with the upcoming Volvo launch. Our Q4 gross loss was higher than our expectations , primarily due to the lumpiness in our industrialization costs and their ramp down. These industrialization costs included fixed cost leverage on lower sensor sales, an increase in estimated development costs for Iris+, and costs associated with improving our Iris production yield and unit costs. Please refer to Footnotes on page 16 for more detail.

We believe 2024 will be a transformational year for Luminar, as we expect to finally industrialize our technology at high volume, accelerate industrialization of our next-gen LiDAR, and improve the efficiency of our business. Our 2024 key business milestones include: 1. Pass final Run at Rate production audit ahead of Volvo SOP; Achieve global SOP & ramp with Volvo 2. Launch TPK facility for additional capacity and improved cost 3. Unveil next-gen LiDAR; Deliver samples to customers 4. Expand ecosystem around the LiDAR ( e.g. Semiconductors, AI Engine, Software, Insurance) FY’23 Business Milestones 1. Industrialization & Scale 2. Product & Technology 3. Business Growth Year-end Goal: Bring the high volume, automated facility in Mexico online; Meet Volvo Cars start of production (SOP) requirements. Status: Achieved. Facility brought online in Q1’23. Year-end Goal: Enter Iris+ C-phase[5]; Complete software[3] requirements for Volvo and Mercedes programs; Develop a next-gen LiDAR prototype. Status: Achieved. Year-end Goal: Grow Order Book[1] by at least $1 billion. Status: Partially achieved. Since 1/1/23, we added new vehicle lines and commercial programs totaling ~$800M to our Order Book. We also refined the calculation of our existing Order Book utilizing IHS volume assumptions and more conservative take rate assumptions. This refined methodology resulted in a net $400M increase in our Order Book since 12/31/22. See our Order Book Update on page 9 for more detail. 7Q4 2023 Quarterly Business Update Targeted FY’24 Business Milestones 7 2024 Revenue Quarter Run Rate of Mid-$30M in 2H’24 Cash & Liquidity[6] >$150M at YE’24 Q1’24 Roughly Similar to Q4’23 We expect to achieve a quarterly run rate of revenue in the mid-$30M range following our expected SOP and ramp with Volvo in 2H’24. This would equate to an annualized run rate of ~$140M in revenue. We expect to end the year with >$150M in Cash & Liquidity, including our recently obtained credit line. We believe our liquidity profile is sufficient to provide at least two years of runway from today. As we prioritize optimizing our Mexico facility and de-risking the start of series production for Volvo, we expect most of our pre-launch financial metrics in Q1’24 to be roughly similar to Q4’23: In line to slightly lower revenue; some improvement to our Non-GAAP gross loss; higher change in cash & liquidity as we build working capital to support Volvo SOP. FY’24 Financial Guidance We are currently providing more limited financial guidance for FY’24. When we have more certainty around the pace of the Volvo production ramp, and corresponding impact on our industrialization and unit economics costs, we plan to provide more detail around our financial guidance, likely towards H2’24. Please refer to Footnotes on page 16 for more detail.
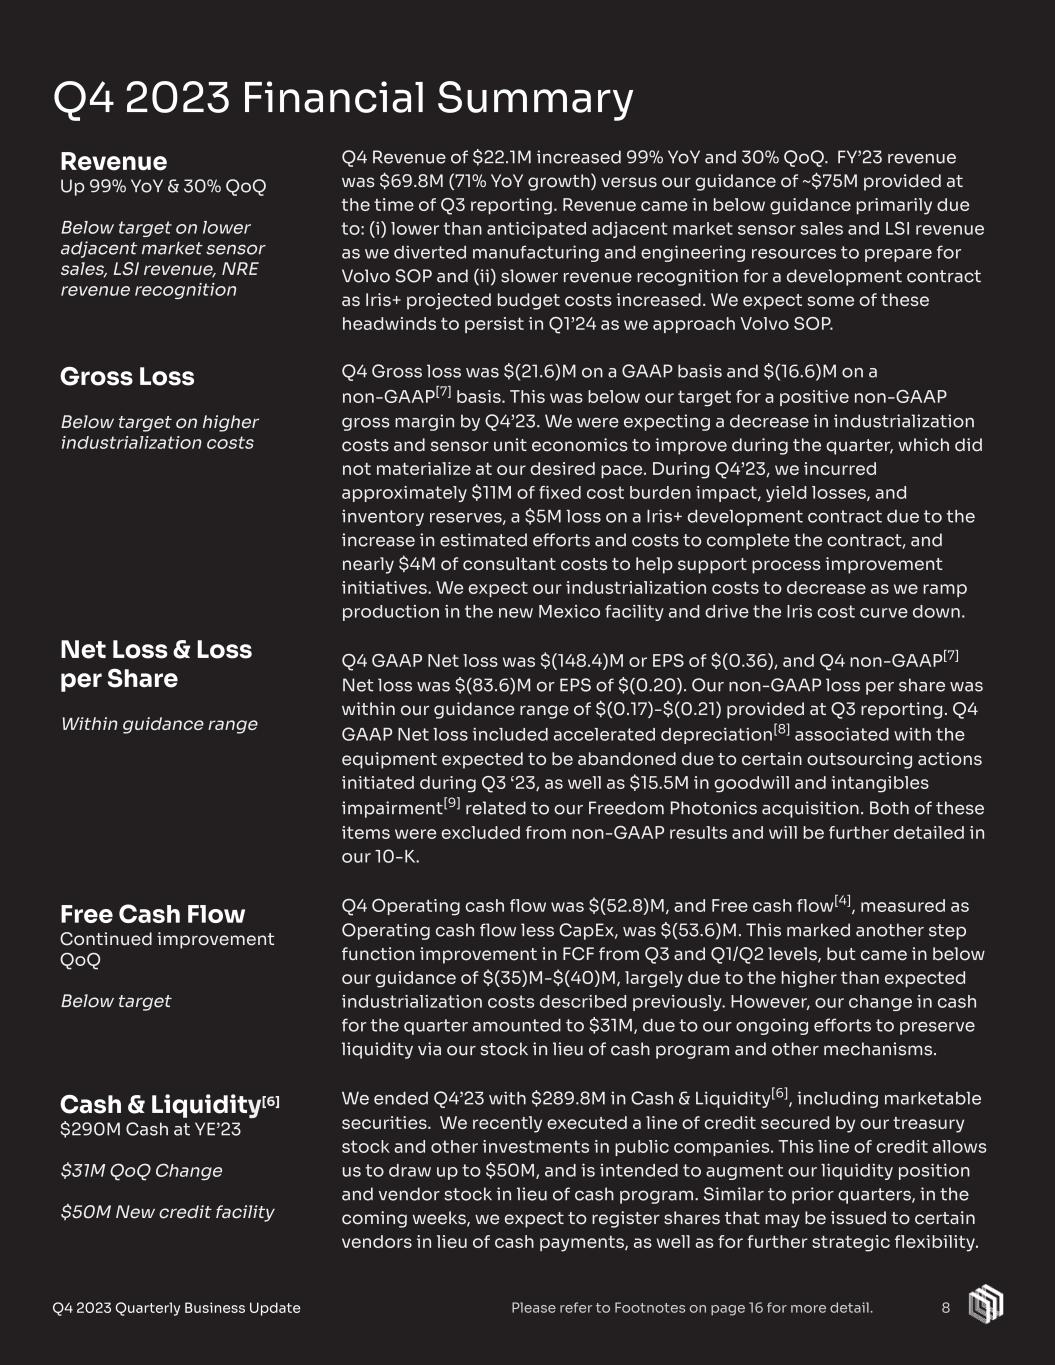
Q4 Revenue of $22.1M increased 99% YoY and 30% QoQ. FY’23 revenue was $69.8M (71% YoY growth) versus our guidance of ~$75M provided at the time of Q3 reporting. Revenue came in below guidance primarily due to: (i) lower than anticipated adjacent market sensor sales and LSI revenue as we diverted manufacturing and engineering resources to prepare for Volvo SOP and (ii) slower revenue recognition for a development contract as Iris+ projected budget costs increased. We expect some of these headwinds to persist in Q1’24 as we approach Volvo SOP. Q4 Gross loss was $(21.6)M on a GAAP basis and $(16.6)M on a non-GAAP[7] basis. This was below our target for a positive non-GAAP gross margin by Q4’23. We were expecting a decrease in industrialization costs and sensor unit economics to improve during the quarter, which did not materialize at our desired pace. During Q4’23, we incurred approximately $11M of fixed cost burden impact, yield losses, and inventory reserves, a $5M loss on a Iris+ development contract due to the increase in estimated efforts and costs to complete the contract, and nearly $4M of consultant costs to help support process improvement initiatives. We expect our industrialization costs to decrease as we ramp production in the new Mexico facility and drive the Iris cost curve down. Q4 GAAP Net loss was $(148.4)M or EPS of $(0.36), and Q4 non-GAAP[7] Net loss was $(83.6)M or EPS of $(0.20). Our non-GAAP loss per share was within our guidance range of $(0.17)-$(0.21) provided at Q3 reporting. Q4 GAAP Net loss included accelerated depreciation[8] associated with the equipment expected to be abandoned due to certain outsourcing actions initiated during Q3 ‘23, as well as $15.5M in goodwill and intangibles impairment[9] related to our Freedom Photonics acquisition. Both of these items were excluded from non-GAAP results and will be further detailed in our 10-K. Q4 Operating cash flow was $(52.8)M, and Free cash flow[4], measured as Operating cash flow less CapEx, was $(53.6)M. This marked another step function improvement in FCF from Q3 and Q1/Q2 levels, but came in below our guidance of $(35)M-$(40)M, largely due to the higher than expected industrialization costs described previously. However, our change in cash for the quarter amounted to $31M, due to our ongoing efforts to preserve liquidity via our stock in lieu of cash program and other mechanisms. We ended Q4’23 with $289.8M in Cash & Liquidity[6], including marketable securities. We recently executed a line of credit secured by our treasury stock and other investments in public companies. This line of credit allows us to draw up to $50M, and is intended to augment our liquidity position and vendor stock in lieu of cash program. Similar to prior quarters, in the coming weeks, we expect to register shares that may be issued to certain vendors in lieu of cash payments, as well as for further strategic flexibility. Revenue Up 99% YoY & 30% QoQ Below target on lower adjacent market sensor sales, LSI revenue, NRE revenue recognition Gross Loss Below target on higher industrialization costs Net Loss & Loss per Share Within guidance range Free Cash Flow Continued improvement QoQ Below target Cash & Liquidity[6] $290M Cash at YE’23 $31M QoQ Change $50M New credit facility Q4 2023 Financial Summary 8Q4 2023 Quarterly Business Update 8Please refer to Footnotes on page 16 for more detail.
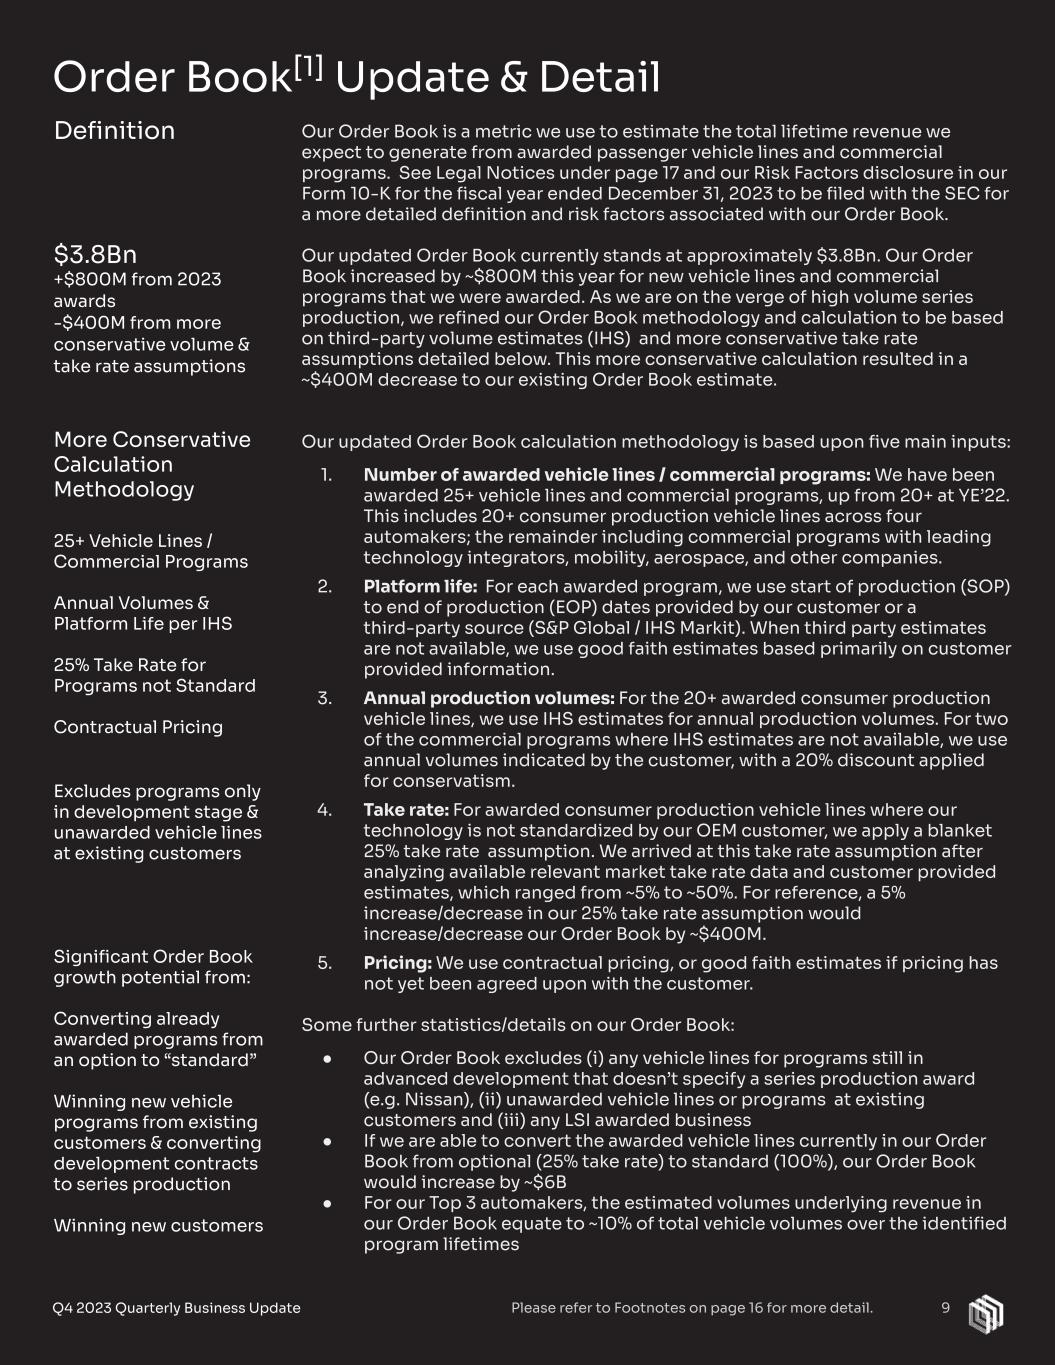
Order Book[1] Update & Detail Our Order Book is a metric we use to estimate the total lifetime revenue we expect to generate from awarded passenger vehicle lines and commercial programs. See Legal Notices under page 17 and our Risk Factors disclosure in our Form 10-K for the fiscal year ended December 31, 2023 to be filed with the SEC for a more detailed definition and risk factors associated with our Order Book. Our updated Order Book currently stands at approximately $3.8Bn. Our Order Book increased by ~$800M this year for new vehicle lines and commercial programs that we were awarded. As we are on the verge of high volume series production, we refined our Order Book methodology and calculation to be based on third-party volume estimates (IHS) and more conservative take rate assumptions detailed below. This more conservative calculation resulted in a ~$400M decrease to our existing Order Book estimate. Our updated Order Book calculation methodology is based upon five main inputs: 1. Number of awarded vehicle lines / commercial programs: We have been awarded 25+ vehicle lines and commercial programs, up from 20+ at YE’22. This includes 20+ consumer production vehicle lines across four automakers; the remainder including commercial programs with leading technology integrators, mobility, aerospace, and other companies. 2. Platform life: For each awarded program, we use start of production (SOP) to end of production (EOP) dates provided by our customer or a third-party source (S&P Global / IHS Markit). When third party estimates are not available, we use good faith estimates based primarily on customer provided information. 3. Annual production volumes: For the 20+ awarded consumer production vehicle lines, we use IHS estimates for annual production volumes. For two of the commercial programs where IHS estimates are not available, we use annual volumes indicated by the customer, with a 20% discount applied for conservatism. 4. Take rate: For awarded consumer production vehicle lines where our technology is not standardized by our OEM customer, we apply a blanket 25% take rate assumption. We arrived at this take rate assumption after analyzing available relevant market take rate data and customer provided estimates, which ranged from ~5% to ~50%. For reference, a 5% increase/decrease in our 25% take rate assumption would increase/decrease our Order Book by ~$400M. 5. Pricing: We use contractual pricing, or good faith estimates if pricing has not yet been agreed upon with the customer. Some further statistics/details on our Order Book: ● Our Order Book excludes (i) any vehicle lines for programs still in advanced development that doesn’t specify a series production award (e.g. Nissan), (ii) unawarded vehicle lines or programs at existing customers and (iii) any LSI awarded business ● If we are able to convert the awarded vehicle lines currently in our Order Book from optional (25% take rate) to standard (100%), our Order Book would increase by ~$6B ● For our Top 3 automakers, the estimated volumes underlying revenue in our Order Book equate to ~10% of total vehicle volumes over the identified program lifetimes 9Q4 2023 Quarterly Business Update Definition $3.8Bn +$800M from 2023 awards -$400M from more conservative volume & take rate assumptions More Conservative Calculation Methodology 25+ Vehicle Lines / Commercial Programs Annual Volumes & Platform Life per IHS 25% Take Rate for Programs not Standard Contractual Pricing Excludes programs only in development stage & unawarded vehicle lines at existing customers Significant Order Book growth potential from: Converting already awarded programs from an option to “standard” Winning new vehicle programs from existing customers & converting development contracts to series production Winning new customers 9Please refer to Footnotes on page 16 for more detail.
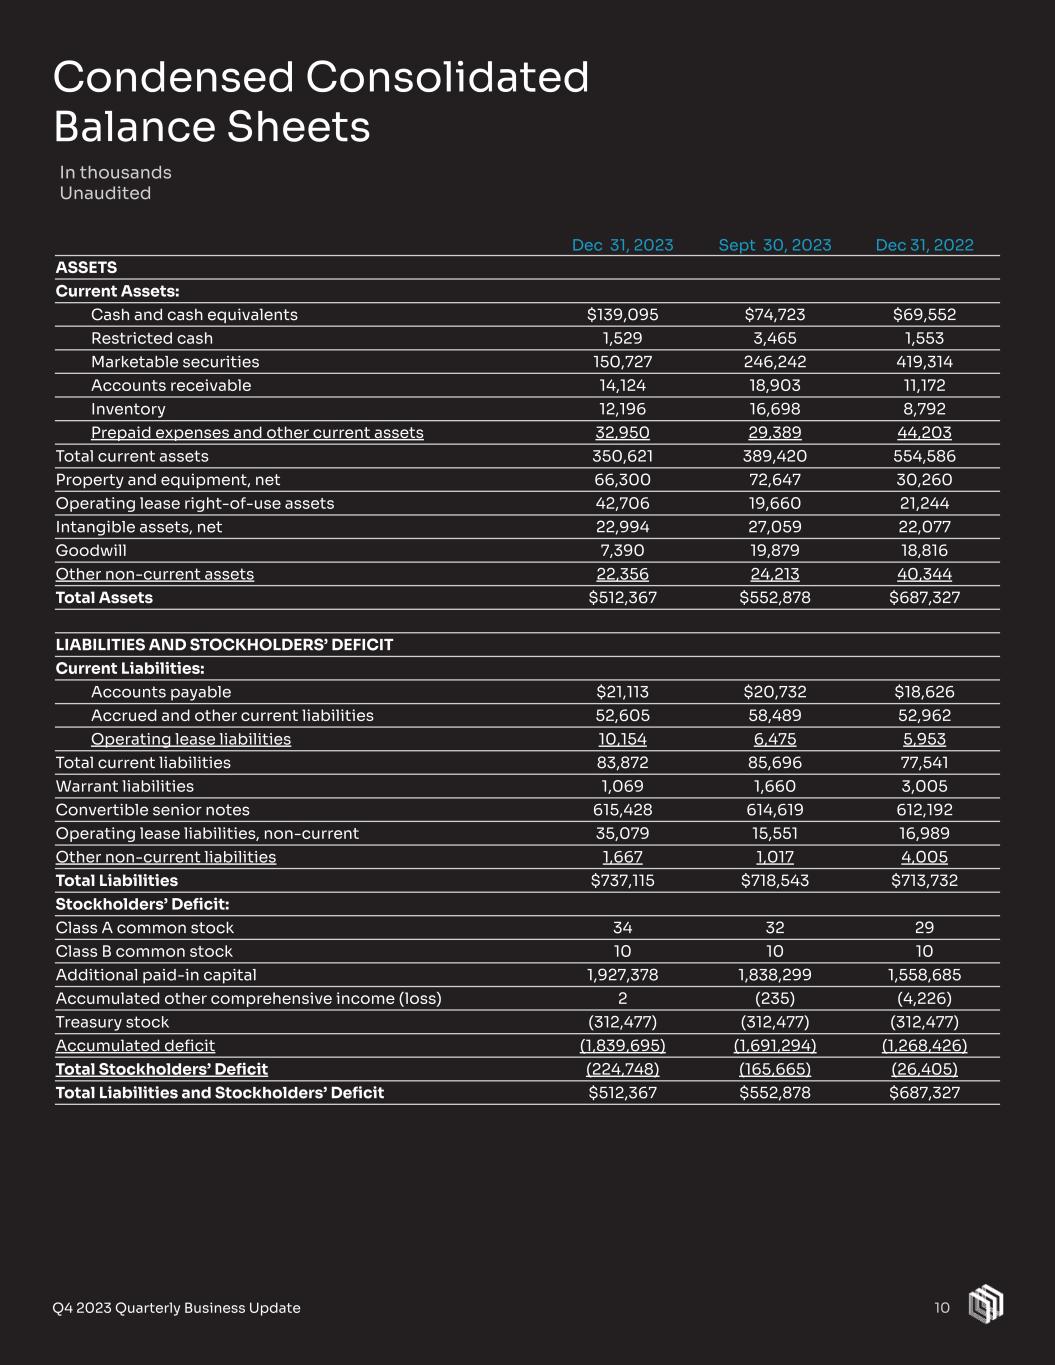
Dec 31, 2023 Sept 30, 2023 Dec 31, 2022 ASSETS Current Assets: Cash and cash equivalents $139,095 $74,723 $69,552 Restricted cash 1,529 3,465 1,553 Marketable securities 150,727 246,242 419,314 Accounts receivable 14,124 18,903 11,172 Inventory 12,196 16,698 8,792 Prepaid expenses and other current assets 32,950 29,389 44,203 Total current assets 350,621 389,420 554,586 Property and equipment, net 66,300 72,647 30,260 Operating lease right-of-use assets 42,706 19,660 21,244 Intangible assets, net 22,994 27,059 22,077 Goodwill 7,390 19,879 18,816 Other non-current assets 22,356 24,213 40,344 Total Assets $512,367 $552,878 $687,327 LIABILITIES AND STOCKHOLDERS’ DEFICIT Current Liabilities: Accounts payable $21,113 $20,732 $18,626 Accrued and other current liabilities 52,605 58,489 52,962 Operating lease liabilities 10,154 6,475 5,953 Total current liabilities 83,872 85,696 77,541 Warrant liabilities 1,069 1,660 3,005 Convertible senior notes 615,428 614,619 612,192 Operating lease liabilities, non-current 35,079 15,551 16,989 Other non-current liabilities 1,667 1,017 4,005 Total Liabilities $737,115 $718,543 $713,732 Stockholders’ Deficit: Class A common stock 34 32 29 Class B common stock 10 10 10 Additional paid-in capital 1,927,378 1,838,299 1,558,685 Accumulated other comprehensive income (loss) 2 (235) (4,226) Treasury stock (312,477) (312,477) (312,477) Accumulated deficit (1,839,695) (1,691,294) (1,268,426) Total Stockholders’ Deficit (224,748) (165,665) (26,405) Total Liabilities and Stockholders’ Deficit $512,367 $552,878 $687,327 Condensed Consolidated Balance Sheets In thousands Unaudited 10Q4 2023 Quarterly Business Update 10
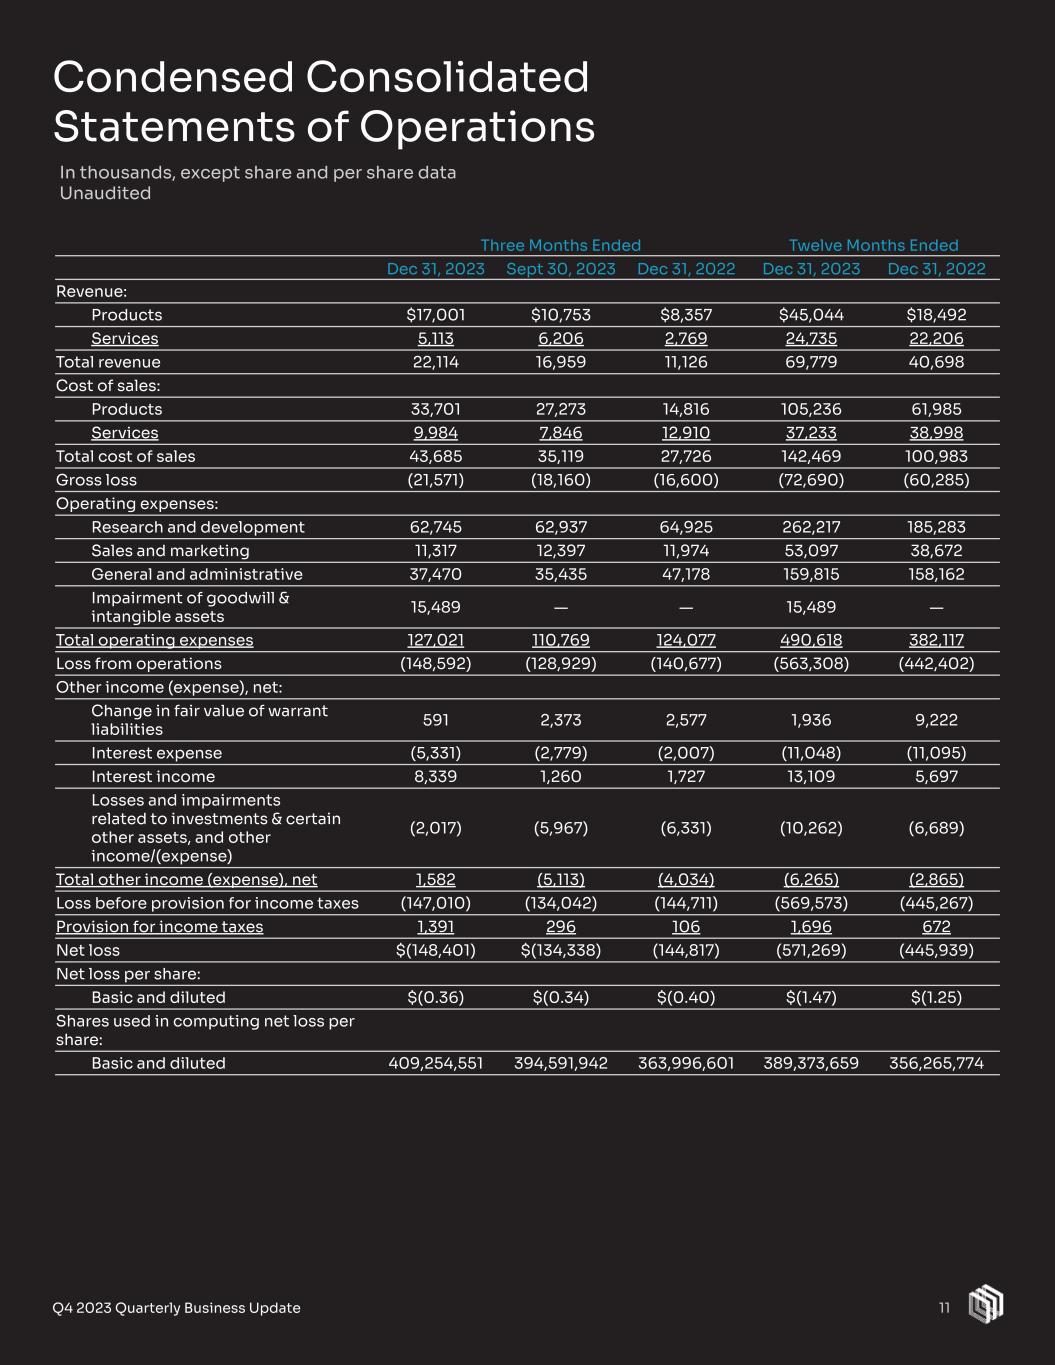
Three Months Ended Twelve Months Ended Dec 31, 2023 Sept 30, 2023 Dec 31, 2022 Dec 31, 2023 Dec 31, 2022 Revenue: Products $17,001 $10,753 $8,357 $45,044 $18,492 Services 5,113 6,206 2,769 24,735 22,206 Total revenue 22,114 16,959 11,126 69,779 40,698 Cost of sales: Products 33,701 27,273 14,816 105,236 61,985 Services 9,984 7,846 12,910 37,233 38,998 Total cost of sales 43,685 35,119 27,726 142,469 100,983 Gross loss (21,571) (18,160) (16,600) (72,690) (60,285) Operating expenses: Research and development 62,745 62,937 64,925 262,217 185,283 Sales and marketing 11,317 12,397 11,974 53,097 38,672 General and administrative 37,470 35,435 47,178 159,815 158,162 Impairment of goodwill & intangible assets 15,489 — — 15,489 — Total operating expenses 127,021 110,769 124,077 490,618 382,117 Loss from operations (148,592) (128,929) (140,677) (563,308) (442,402) Other income (expense), net: Change in fair value of warrant liabilities 591 2,373 2,577 1,936 9,222 Interest expense (5,331) (2,779) (2,007) (11,048) (11,095) Interest income 8,339 1,260 1,727 13,109 5,697 Losses and impairments related to investments & certain other assets, and other income/(expense) (2,017) (5,967) (6,331) (10,262) (6,689) Total other income (expense), net 1,582 (5,113) (4,034) (6,265) (2,865) Loss before provision for income taxes (147,010) (134,042) (144,711) (569,573) (445,267) Provision for income taxes 1,391 296 106 1,696 672 Net loss $(148,401) $(134,338) (144,817) (571,269) (445,939) Net loss per share: Basic and diluted $(0.36) $(0.34) $(0.40) $(1.47) $(1.25) Shares used in computing net loss per share: Basic and diluted 409,254,551 394,591,942 363,996,601 389,373,659 356,265,774 Condensed Consolidated Statements of Operations 11Q4 2023 Quarterly Business Update In thousands, except share and per share data Unaudited 11

Condensed Consolidated Statements of Cash Flows 12Q4 2023 Quarterly Business Update In thousands, Unaudited Twelve Months Ended Dec 31, 2023 2022 Cash flows from operating activities: Net loss $(571,269) $(445,939) Adjustments to reconcile net loss to net cash used in operating activities: Depreciation and amortization 26,624 6,566 Amortization of operating lease right-of-use assets 6,987 5,237 Amortization of premium (discount) on marketable securities (5,929) 1,288 Loss on marketable securities 7,594 — Losses & impairments on non-marketable securities & certain other assets 2,141 6,016 Change in fair value of warrants (1,936) (9,222) Vendor stock-in-lieu of cash program 50,829 41,459 Amortization of debt discount and issuance costs 3,236 3,236 Inventory write-offs and write-downs 19,547 12,154 Write-off or loss on sale or disposal of property and equipment 1,522 — Share-based compensation 207,132 162,405 Impairment of goodwill and intangible assets 15,489 — Product warranty 2,382 2,481 Deferred taxes (64) 232 Changes in operating assets and liabilities: Accounts receivable (2,951) 5,144 Inventories (22,951) (10,477) Prepaid expenses and other current assets 11,641 (6,557) Other non-current assets 177 (3,289) Accounts payable 3,657 5,301 Accrued and other current liabilities 9,158 17,768 Other non-current liabilities (10,320) (2,035) Net cash used in operating activities $(247,304) $(208,232) Cash flows from investing activities: Acquisition of Freedom Photonics LLC (net of cash acquired) — (2,759) Acquisition of certain assets from Solfice Research, Inc. — (2,001) Acquisition of Seagate’s LiDAR business (12,608) — Purchases of marketable securities (301,493) (404,598) Proceeds from maturities of marketable securities 520,286 367,367 Proceeds from sales/redemptions of marketable securities 52,356 88,041 Purchases of property and equipment (21,915) (15,614) Advances for capital projects and equipment — (2,450) Net cash provided by investing activities $236,626 $27,986 Cash flows from financing activities: Net proceeds from issuance of Class A common stock under Equity Financing Program 50,190 — Proceeds from issuance of Class A common stock to a TPK Group company 20,000 — Proceeds from a financing transaction 6,442 — Proceeds from exercise of stock options 3,061 3,986 Proceeds from sale of Class A common stock under ESPP 2,641 1,271 Payments of employee taxes related to stock-based awards (2,137) (3,730) Repurchase of common stock — (80,878) Net cash provided by (used in) financing activities $80,197 $(79,351) Net increase (decrease) in cash, cash equivalents and restricted cash $69,519 $(259,597) Beginning cash, cash equivalents and restricted cash 71,105 330,702 Ending cash, cash equivalents and restricted cash $140,624 $71,105 12
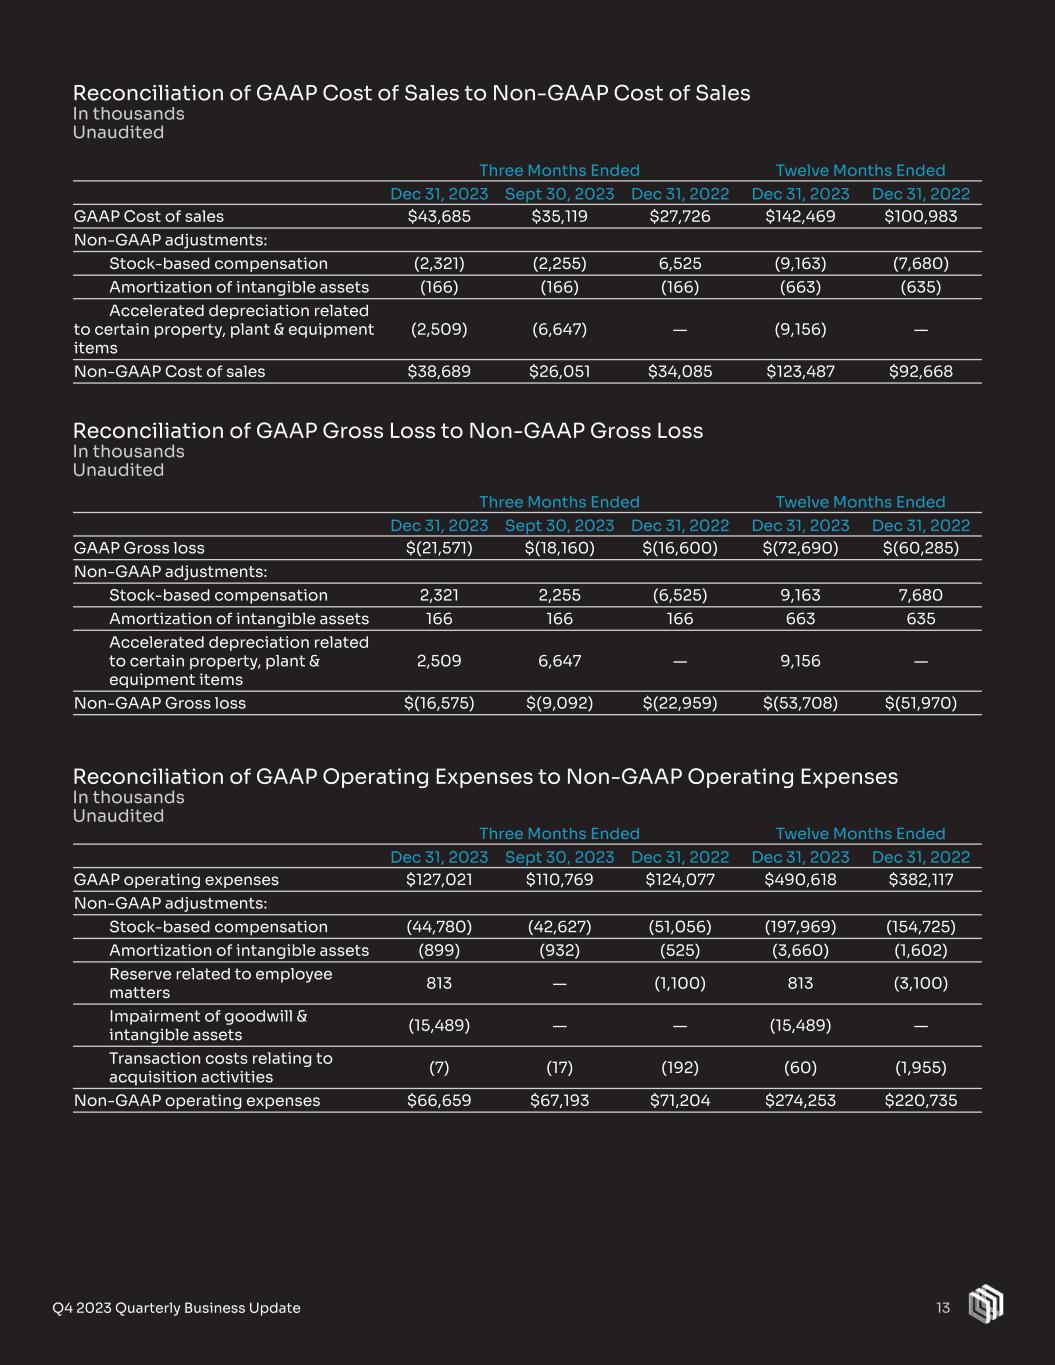
Three Months Ended Twelve Months Ended Dec 31, 2023 Sept 30, 2023 Dec 31, 2022 Dec 31, 2023 Dec 31, 2022 GAAP Gross loss $(21,571) $(18,160) $(16,600) $(72,690) $(60,285) Non-GAAP adjustments: Stock-based compensation 2,321 2,255 (6,525) 9,163 7,680 Amortization of intangible assets 166 166 166 663 635 Accelerated depreciation related to certain property, plant & equipment items 2,509 6,647 — 9,156 — Non-GAAP Gross loss $(16,575) $(9,092) $(22,959) $(53,708) $(51,970) 13Q4 2023 Quarterly Business Update Reconciliation of GAAP Cost of Sales to Non-GAAP Cost of Sales In thousands Unaudited Reconciliation of GAAP Gross Loss to Non-GAAP Gross Loss In thousands Unaudited Three Months Ended Twelve Months Ended Dec 31, 2023 Sept 30, 2023 Dec 31, 2022 Dec 31, 2023 Dec 31, 2022 GAAP operating expenses $127,021 $110,769 $124,077 $490,618 $382,117 Non-GAAP adjustments: Stock-based compensation (44,780) (42,627) (51,056) (197,969) (154,725) Amortization of intangible assets (899) (932) (525) (3,660) (1,602) Reserve related to employee matters 813 — (1,100) 813 (3,100) Impairment of goodwill & intangible assets (15,489) — — (15,489) — Transaction costs relating to acquisition activities (7) (17) (192) (60) (1,955) Non-GAAP operating expenses $66,659 $67,193 $71,204 $274,253 $220,735 Reconciliation of GAAP Operating Expenses to Non-GAAP Operating Expenses In thousands Unaudited Three Months Ended Twelve Months Ended Dec 31, 2023 Sept 30, 2023 Dec 31, 2022 Dec 31, 2023 Dec 31, 2022 GAAP Cost of sales $43,685 $35,119 $27,726 $142,469 $100,983 Non-GAAP adjustments: Stock-based compensation (2,321) (2,255) 6,525 (9,163) (7,680) Amortization of intangible assets (166) (166) (166) (663) (635) Accelerated depreciation related to certain property, plant & equipment items (2,509) (6,647) — (9,156) — Non-GAAP Cost of sales $38,689 $26,051 $34,085 $123,487 $92,668 13

14Q4 2023 Quarterly Business Update Three Months Ended Twelve Months Ended Dec 31, 2023 Sept 30, 2023 Dec 31, 2022 Dec 31, 2023 Dec 31, 2022 GAAP Net loss $(148,401) $(134,338) $(144,817) $(571,269) $(445,939) Non-GAAP adjustments: Stock-based compensation 47,101 44,882 44,531 207,132 162,405 Amortization of intangible assets 1,065 1,098 691 4,323 2,237 Accelerated depreciation related to certain property, plant & equipment items 2,509 6,647 — 9,156 — Impairment of goodwill & intangible assets 15,489 — — 15,489 — Impairment of investments & certain other assets — — 6,002 — 6,002 Legal reserve related to employee matters (813) — 1,100 (813) 3,100 Transaction costs relating to acquisition activities 7 17 192 60 1,955 Change in fair value of warrant liabilities (591) (2,373) (2,577) (1,936) (9,222) Provision for income taxes — — — — 165 Non-GAAP Net loss $(83,634) $(84,067) $(94,878) $(337,858) $(279,297) GAAP Net loss per share: Basic and diluted $(0.36) $(0.34) $(0.40) $(1.47) $(1.25) Non-GAAP Net loss per share Basic and diluted $(0.20) $(0.21) $(0.26) $(0.87) $(0.78) Shares used in computing GAAP Net loss per share Basic and diluted 409,254,551 394,591,942 363,996,601 389,373,659 356,265,774 Shares used in computing Non-GAAP Net loss per share Basic and diluted 409,254,551 394,591,942 363,996,601 389,373,659 356,265,774 Reconciliation of GAAP Net Loss to Non-GAAP Net Loss In thousands, except share and per share data Unaudited 14
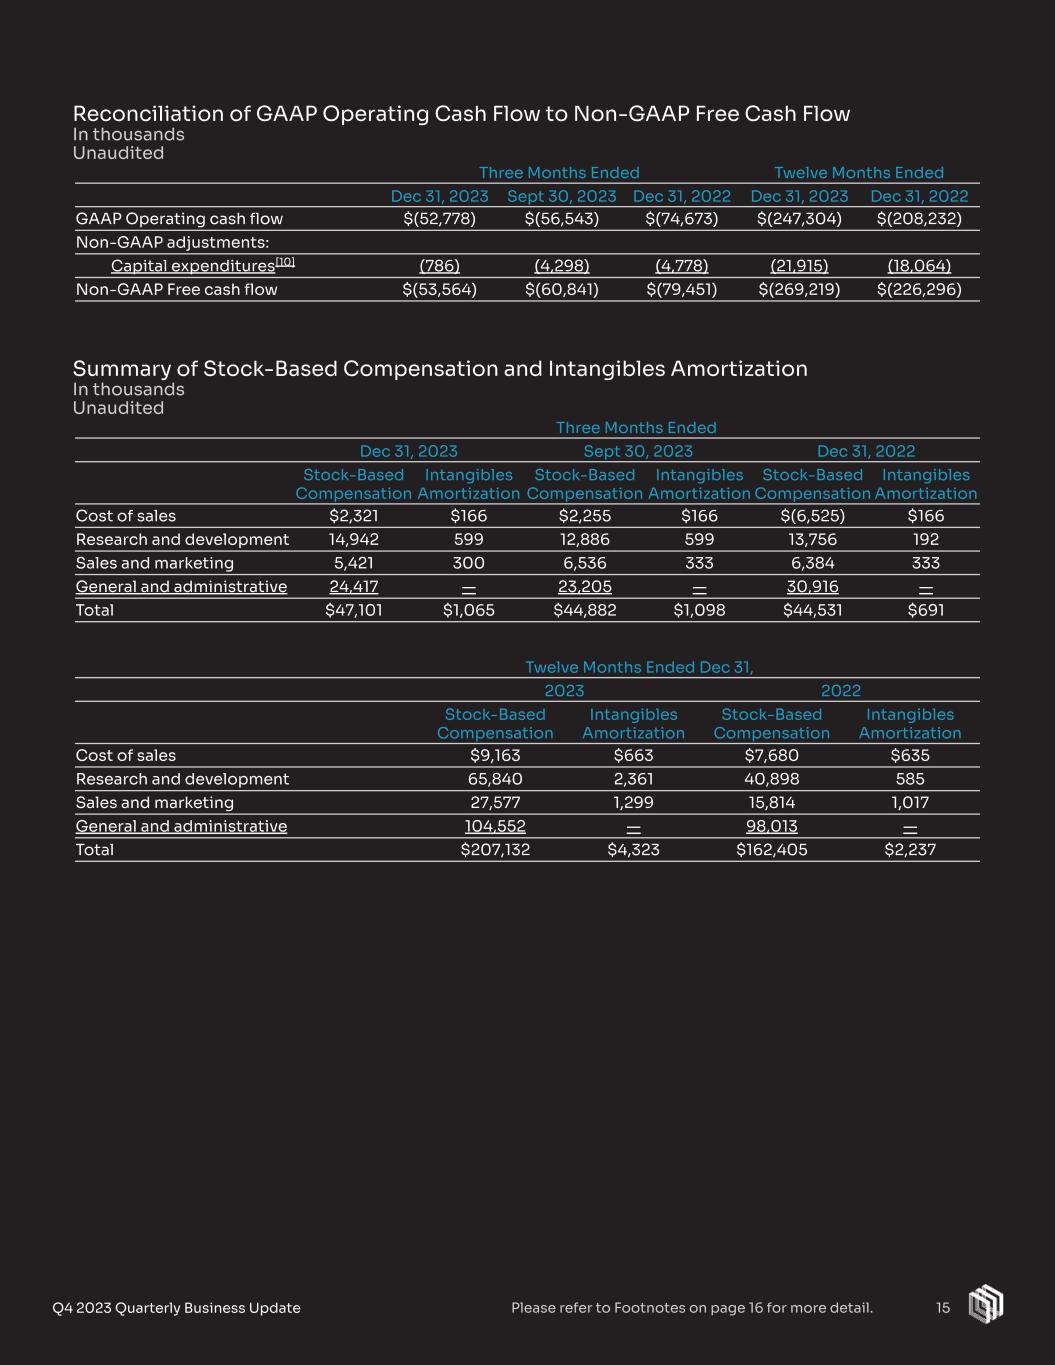
15Q4 2023 Quarterly Business Update Reconciliation of GAAP Operating Cash Flow to Non-GAAP Free Cash Flow In thousands Unaudited Summary of Stock-Based Compensation and Intangibles Amortization In thousands Unaudited Three Months Ended Twelve Months Ended Dec 31, 2023 Sept 30, 2023 Dec 31, 2022 Dec 31, 2023 Dec 31, 2022 GAAP Operating cash flow $(52,778) $(56,543) $(74,673) $(247,304) $(208,232) Non-GAAP adjustments: Capital expenditures[10] (786) (4,298) (4,778) (21,915) (18,064) Non-GAAP Free cash flow $(53,564) $(60,841) $(79,451) $(269,219) $(226,296) Three Months Ended Dec 31, 2023 Sept 30, 2023 Dec 31, 2022 Stock-Based Compensation Intangibles Amortization Stock-Based Compensation Intangibles Amortization Stock-Based Compensation Intangibles Amortization Cost of sales $2,321 $166 $2,255 $166 $(6,525) $166 Research and development 14,942 599 12,886 599 13,756 192 Sales and marketing 5,421 300 6,536 333 6,384 333 General and administrative 24,417 — 23,205 — 30,916 — Total $47,101 $1,065 $44,882 $1,098 $44,531 $691 Twelve Months Ended Dec 31, 2023 2022 Stock-Based Compensation Intangibles Amortization Stock-Based Compensation Intangibles Amortization Cost of sales $9,163 $663 $7,680 $635 Research and development 65,840 2,361 40,898 585 Sales and marketing 27,577 1,299 15,814 1,017 General and administrative 104,552 — 98,013 — Total $207,132 $4,323 $162,405 $2,237 15Please refer to Footnotes on page 16 for more detail.
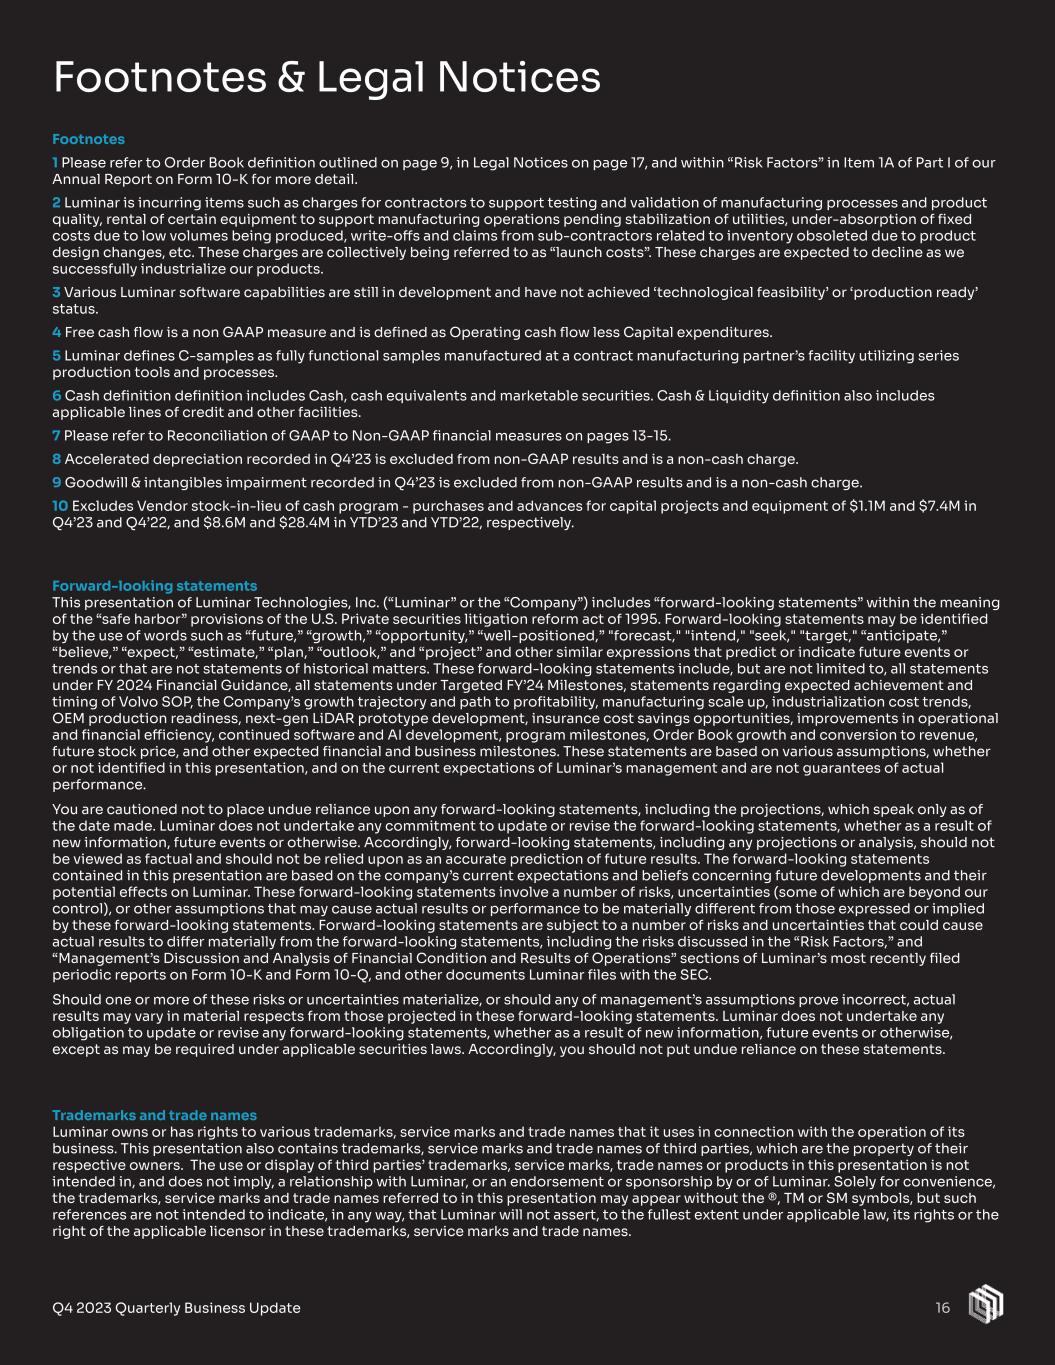
16Q4 2023 Quarterly Business Update Footnotes & Legal Notices Footnotes 1 Please refer to Order Book definition outlined on page 9, in Legal Notices on page 17, and within “Risk Factors” in Item 1A of Part I of our Annual Report on Form 10-K for more detail. 2 Luminar is incurring items such as charges for contractors to support testing and validation of manufacturing processes and product quality, rental of certain equipment to support manufacturing operations pending stabilization of utilities, under-absorption of fixed costs due to low volumes being produced, write-offs and claims from sub-contractors related to inventory obsoleted due to product design changes, etc. These charges are collectively being referred to as “launch costs”. These charges are expected to decline as we successfully industrialize our products. 3 Various Luminar software capabilities are still in development and have not achieved ‘technological feasibility’ or ‘production ready’ status. 4 Free cash flow is a non GAAP measure and is defined as Operating cash flow less Capital expenditures. 5 Luminar defines C-samples as fully functional samples manufactured at a contract manufacturing partner’s facility utilizing series production tools and processes. 6 Cash definition definition includes Cash, cash equivalents and marketable securities. Cash & Liquidity definition also includes applicable lines of credit and other facilities. 7 Please refer to Reconciliation of GAAP to Non-GAAP financial measures on pages 13-15. 8 Accelerated depreciation recorded in Q4’23 is excluded from non-GAAP results and is a non-cash charge. 9 Goodwill & intangibles impairment recorded in Q4’23 is excluded from non-GAAP results and is a non-cash charge. 10 Excludes Vendor stock-in-lieu of cash program - purchases and advances for capital projects and equipment of $1.1M and $7.4M in Q4’23 and Q4’22, and $8.6M and $28.4M in YTD’23 and YTD’22, respectively. Forward-looking statements This presentation of Luminar Technologies, Inc. (“Luminar” or the “Company”) includes “forward-looking statements” within the meaning of the “safe harbor” provisions of the U.S. Private securities litigation reform act of 1995. Forward-looking statements may be identified by the use of words such as “future,” “growth,” “opportunity,” “well-positioned,” "forecast," "intend," "seek," "target," “anticipate,” “believe,” “expect,” “estimate,” “plan,” “outlook,” and “project” and other similar expressions that predict or indicate future events or trends or that are not statements of historical matters. These forward-looking statements include, but are not limited to, all statements under FY 2024 Financial Guidance, all statements under Targeted FY’24 Milestones, statements regarding expected achievement and timing of Volvo SOP, the Company’s growth trajectory and path to profitability, manufacturing scale up, industrialization cost trends, OEM production readiness, next-gen LiDAR prototype development, insurance cost savings opportunities, improvements in operational and financial efficiency, continued software and AI development, program milestones, Order Book growth and conversion to revenue, future stock price, and other expected financial and business milestones. These statements are based on various assumptions, whether or not identified in this presentation, and on the current expectations of Luminar’s management and are not guarantees of actual performance. You are cautioned not to place undue reliance upon any forward-looking statements, including the projections, which speak only as of the date made. Luminar does not undertake any commitment to update or revise the forward-looking statements, whether as a result of new information, future events or otherwise. Accordingly, forward-looking statements, including any projections or analysis, should not be viewed as factual and should not be relied upon as an accurate prediction of future results. The forward-looking statements contained in this presentation are based on the company’s current expectations and beliefs concerning future developments and their potential effects on Luminar. These forward-looking statements involve a number of risks, uncertainties (some of which are beyond our control), or other assumptions that may cause actual results or performance to be materially different from those expressed or implied by these forward-looking statements. Forward-looking statements are subject to a number of risks and uncertainties that could cause actual results to differ materially from the forward-looking statements, including the risks discussed in the “Risk Factors,” and “Management’s Discussion and Analysis of Financial Condition and Results of Operations” sections of Luminar’s most recently filed periodic reports on Form 10-K and Form 10-Q, and other documents Luminar files with the SEC. Should one or more of these risks or uncertainties materialize, or should any of management’s assumptions prove incorrect, actual results may vary in material respects from those projected in these forward-looking statements. Luminar does not undertake any obligation to update or revise any forward-looking statements, whether as a result of new information, future events or otherwise, except as may be required under applicable securities laws. Accordingly, you should not put undue reliance on these statements. Trademarks and trade names Luminar owns or has rights to various trademarks, service marks and trade names that it uses in connection with the operation of its business. This presentation also contains trademarks, service marks and trade names of third parties, which are the property of their respective owners. The use or display of third parties’ trademarks, service marks, trade names or products in this presentation is not intended in, and does not imply, a relationship with Luminar, or an endorsement or sponsorship by or of Luminar. Solely for convenience, the trademarks, service marks and trade names referred to in this presentation may appear without the ®, TM or SM symbols, but such references are not intended to indicate, in any way, that Luminar will not assert, to the fullest extent under applicable law, its rights or the right of the applicable licensor in these trademarks, service marks and trade names. 16

17Q4 2023 Quarterly Business Update Legal Notices Industry and market data In this presentation, Luminar relies on and refers to information and statistics regarding the sectors in which Luminar competes and other industry data. Luminar obtained this information and statistics from third-party sources, including reports by market research firms. Although Luminar believes these sources are reliable, the company has not independently verified the information and does not guarantee its accuracy and completeness. Luminar has supplemented this information where necessary with information from discussions with Luminar customers and Luminar’s own internal estimates, taking into account publicly available information about other industry participants and Luminar’s management’s best view as to information that is not publicly available. Use of non-GAAP financial measures In addition to disclosing financial measures prepared in accordance with U.S. generally accepted accounting principles (GAAP), this presentation contains certain non-GAAP financial measures and certain other metrics. Non-GAAP financial measures and these other metrics do not have any standardized meaning and are therefore unlikely to be comparable to similarly titled measures and metrics presented by other companies. Luminar considers these non-GAAP financial measures and metrics to be important because they provide useful measures of the operating performance of the Company, exclusive of factors that do not directly affect what we consider to be our core operating performance, as well as unusual events. The Company’s management uses these measures and metrics to (i) illustrate underlying trends in the Company’s business that could otherwise be masked by the effect of income or expenses that are excluded from non-GAAP measures, and (ii) establish budgets and operational goals for managing the Company’s business and evaluating its performance. In addition, investors often use similar measures to evaluate the operating performance of a company. Non-GAAP financial measures and metrics are presented only as supplemental information for purposes of understanding the Company’s operating results. The non-GAAP financial measures and metrics should not be considered a substitute for financial information presented in accordance with GAAP. This presentation includes non-GAAP financial measures, including non-GAAP cost of sales, gross loss/gross profit, net loss and Free Cash Flow. Non-GAAP cost of sales is defined as GAAP cost of sales adjusted for stock-based compensation expense, amortization of intangible assets, and accelerated depreciation related to certain property, plant and equipment items. Non-GAAP gross loss/gross profit is defined as GAAP gross loss/gross profit adjusted for stock-based compensation expense, amortization of intangible assets, and accelerated depreciation related to certain property, plant and equipment items. Non-GAAP net loss is defined as GAAP net loss adjusted for stock-based compensation expense, amortization of intangible assets, accelerated depreciation related to certain property, plant and equipment items, legal reserve related to employee matters, transaction costs relating to acquisition activities, change in fair value of warrant liabilities, and provision for income taxes. Free Cash Flow is defined as operating cash flow less capital expenditures. We use “Order Book” as a metric to measure performance against anticipated achievement of planned key milestones of our business. Order Book is defined as the forward-looking cumulative billings estimate of Luminar’s hardware and software products over the lifetime of given vehicle production programs which Luminar’s technology is expected to be integrated into or provided for, based primarily on projected / actual contractual pricing terms and our good faith estimates of “take rate” of Luminar’s technology on vehicles. “Take rates” are the anticipated percentage of new vehicles to be equipped with Luminar’s technology based on a combination of original equipment manufacturer (“OEM”) product offering decisions and predicted end consumer purchasing decisions. For programs where we are standard, we assume a 100% take rate, while for programs where we are optional we assume a flat 25%. We include programs in our Order Book when (a) we have obtained a written or verbal agreement (e.g. non-binding expression of interest arrangement or an agreement for non-recurring engineering project), other reasonable expression of commitment, or public announcement with a major industry player, and (b) we expect to ultimately be awarded a significant commercial program. We believe Order Book provides useful information to investors as a supplemental performance metric as our products are currently in a pre-production stage and therefore there are currently no billings or revenues from commercial grade product sales. OEMs customarily place non-cancelable purchase orders with their automotive component suppliers only shortly before or during production. Consequently, we use Order Book to inform investors about the progress of expected adoption of our technologies by OEMs because there is, in our view, no other better metric available at our stage. The Order Book estimate may be impacted by various factors, as described in “Risk Factors” in Item 1A of Part I of our Annual Report on Form 10-K for the most recent fiscal year and subsequent filings with the Securities and Exchange Commission, including, but not limited to the following: (i) None of our customers make contractual commitments to use our lidar sensors and software until all test and validation activities have been completed, they have finalized plans for integrating our systems, have a positive expectation of the market demand for our features, and unrelated to us, have determined that their vehicle is ready for market and there is appropriate consumer demand. Consequently, there is no assurance or guarantee that any of our customers, including any programs which we included in our Order Book estimates will ever complete such testing and validation or enter into a definitive volume production agreement with us or that we will receive any billings or revenues forecasted in connection with such programs; (ii) The development cycles of our products with new customers vary widely depending on the application, market, customer and the complexity of the product. In the automotive market, for example, this development cycle can be as long as seven or more years. Variability in development cycles make it difficult to reliably estimate the pricing, volume or timing of purchases of our products by our customers; (iii) Customers cancel or postpone implementation of our technology; (iv) We may not be able to integrate our technology successfully into a larger system with other sensing modalities; and (v) The product or vehicle model that is expected to include our lidar products may be unsuccessful, including for reasons unrelated to our technology. These risks and uncertainties may cause our future actual sales to be materially different than that implied by the Order Book metric. 17