
Quarterly Business Update Q3 2023 Please see Legal Notices at the end of this report for explanation of Forward-Looking Statements and important cautions.
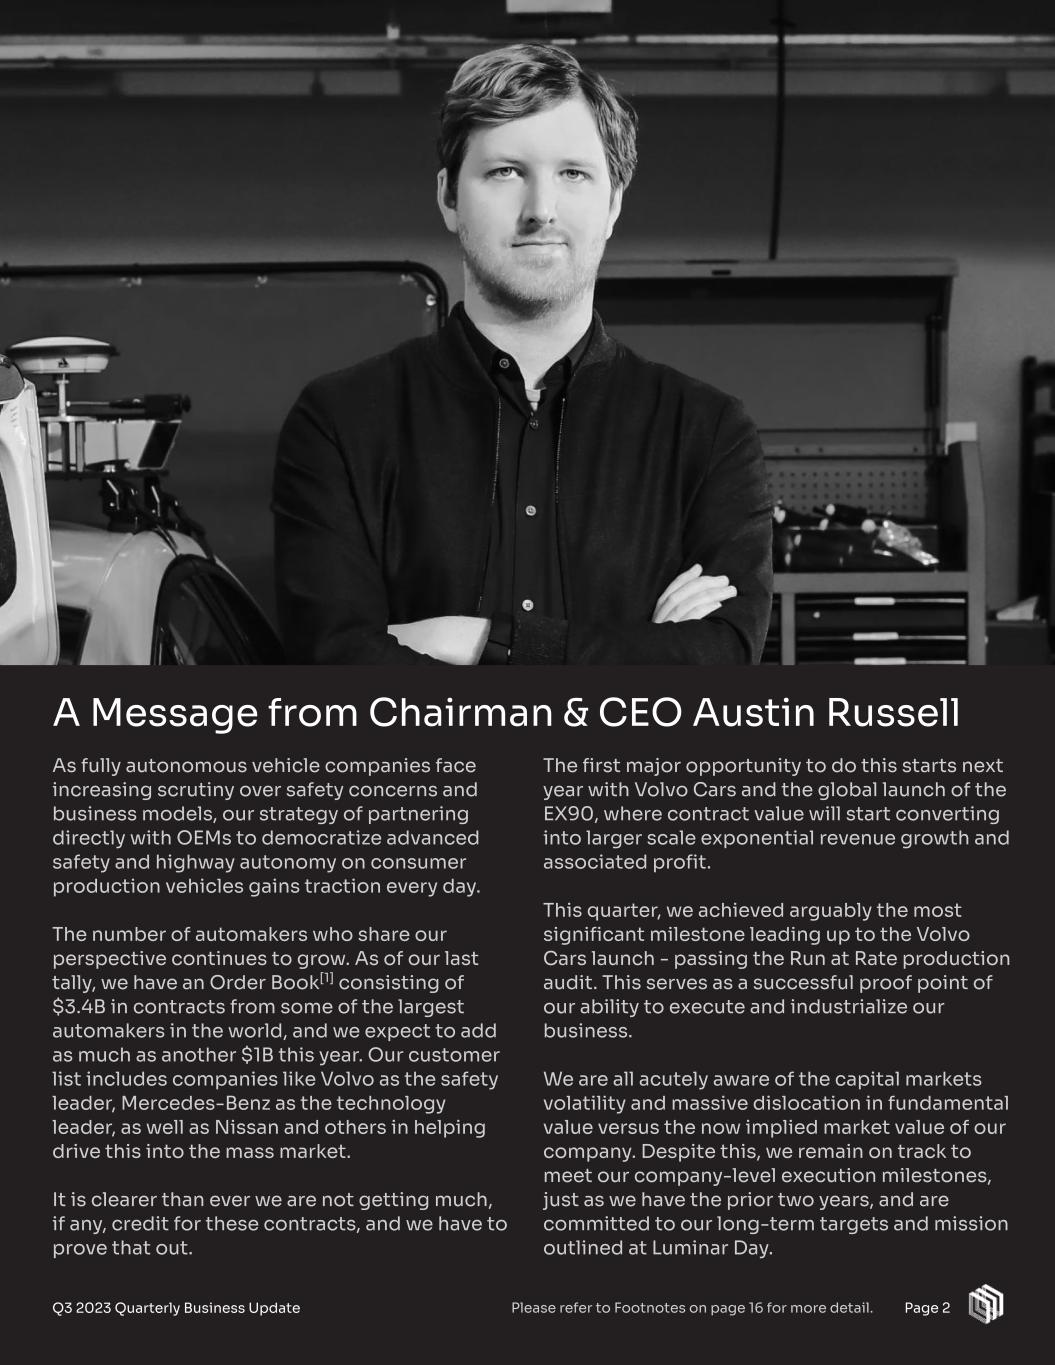
As fully autonomous vehicle companies face increasing scrutiny over safety concerns and business models, our strategy of partnering directly with OEMs to democratize advanced safety and highway autonomy on consumer production vehicles gains traction every day. The number of automakers who share our perspective continues to grow. As of our last tally, we have an Order Book[1] consisting of $3.4B in contracts from some of the largest automakers in the world, and we expect to add as much as another $1B this year. Our customer list includes companies like Volvo as the safety leader, Mercedes-Benz as the technology leader, as well as Nissan and others in helping drive this into the mass market. It is clearer than ever we are not getting much, if any, credit for these contracts, and we have to prove that out. Page 2 A Message from Chairman & CEO Austin Russell The first major opportunity to do this starts next year with Volvo Cars and the global launch of the EX90, where contract value will start converting into larger scale exponential revenue growth and associated profit. This quarter, we achieved arguably the most significant milestone leading up to the Volvo Cars launch - passing the Run at Rate production audit. This serves as a successful proof point of our ability to execute and industrialize our business. We are all acutely aware of the capital markets volatility and massive dislocation in fundamental value versus the now implied market value of our company. Despite this, we remain on track to meet our company-level execution milestones, just as we have the prior two years, and are committed to our long-term targets and mission outlined at Luminar Day. Please refer to Footnotes on page 16 for more detail. Q3 2023 Quarterly Business Update
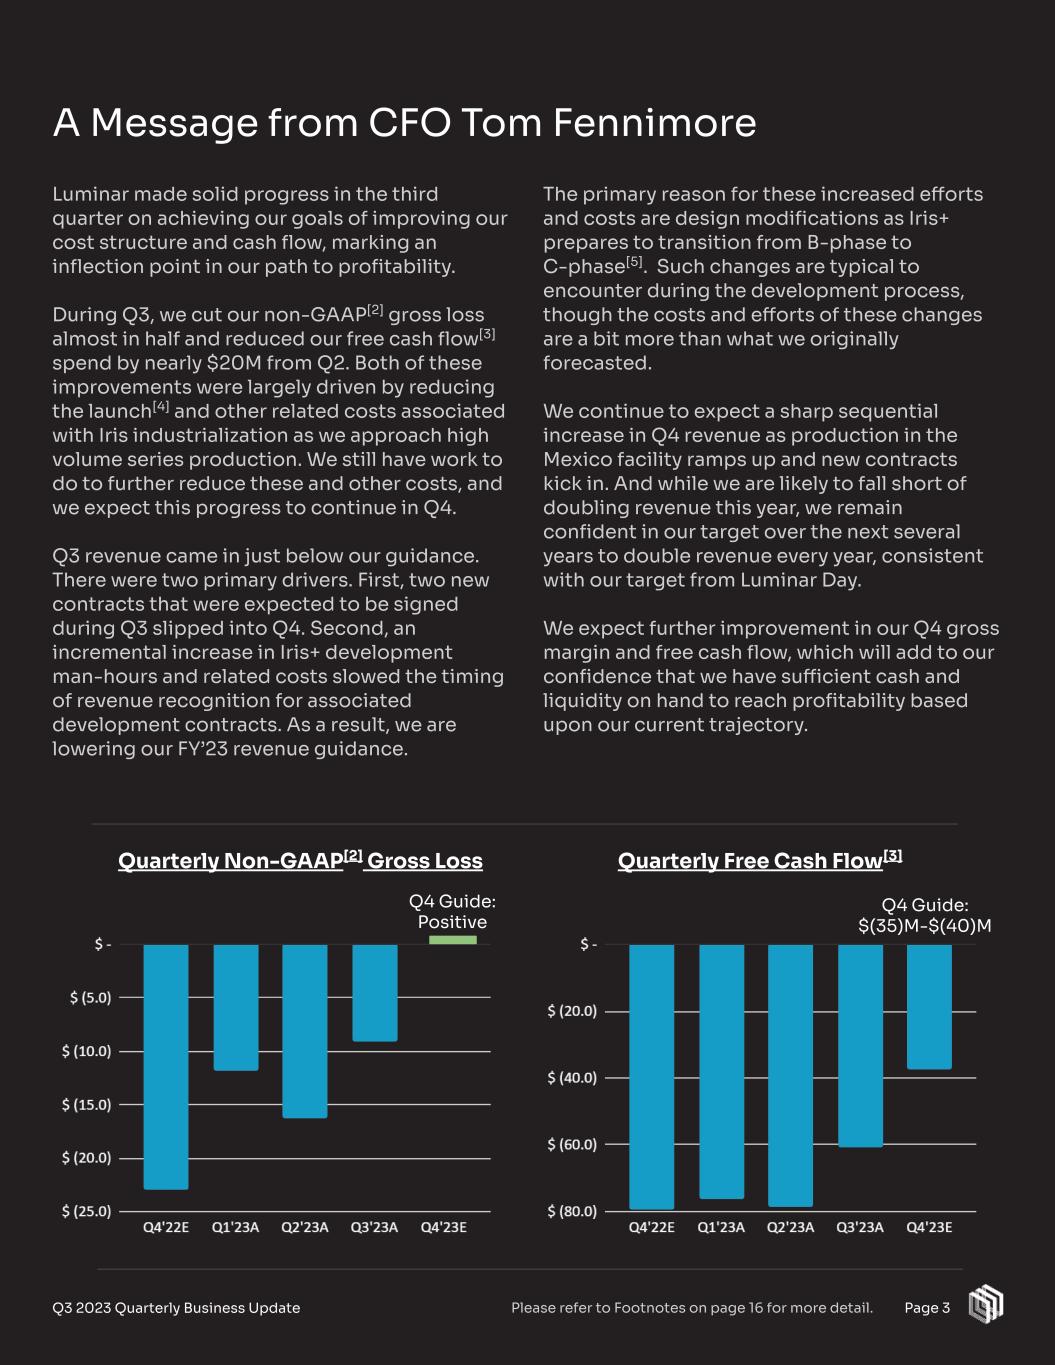
Q4 Guide: Positive Page 3 A Message from CFO Tom Fennimore Q3 2023 Quarterly Business Update Luminar made solid progress in the third quarter on achieving our goals of improving our cost structure and cash flow, marking an inflection point in our path to profitability. During Q3, we cut our non-GAAP[2] gross loss almost in half and reduced our free cash flow[3] spend by nearly $20M from Q2. Both of these improvements were largely driven by reducing the launch[4] and other related costs associated with Iris industrialization as we approach high volume series production. We still have work to do to further reduce these and other costs, and we expect this progress to continue in Q4. Q3 revenue came in just below our guidance. There were two primary drivers. First, two new contracts that were expected to be signed during Q3 slipped into Q4. Second, an incremental increase in Iris+ development man-hours and related costs slowed the timing of revenue recognition for associated development contracts. As a result, we are lowering our FY’23 revenue guidance. Q4 Guide: $(35)M-$(40)M Quarterly Non-GAAP[2] Gross Loss Quarterly Free Cash Flow[3] The primary reason for these increased efforts and costs are design modifications as Iris+ prepares to transition from B-phase to C-phase[5]. Such changes are typical to encounter during the development process, though the costs and efforts of these changes are a bit more than what we originally forecasted. We continue to expect a sharp sequential increase in Q4 revenue as production in the Mexico facility ramps up and new contracts kick in. And while we are likely to fall short of doubling revenue this year, we remain confident in our target over the next several years to double revenue every year, consistent with our target from Luminar Day. We expect further improvement in our Q4 gross margin and free cash flow, which will add to our confidence that we have sufficient cash and liquidity on hand to reach profitability based upon our current trajectory. Please refer to Footnotes on page 16 for more detail.
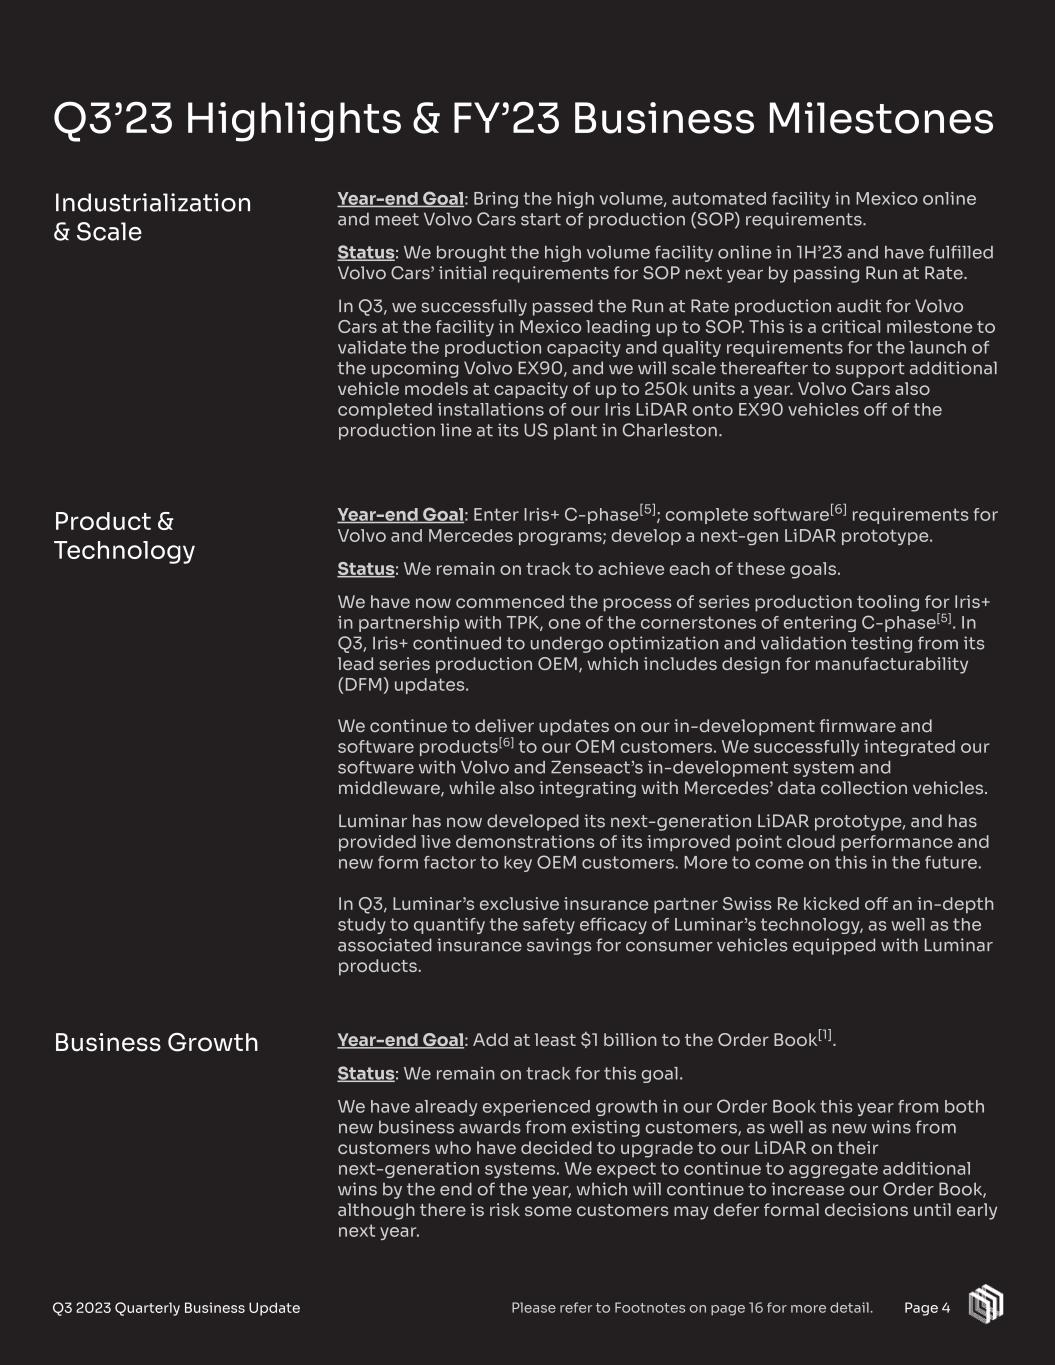
Year-end Goal: Bring the high volume, automated facility in Mexico online and meet Volvo Cars start of production (SOP) requirements. Status: We brought the high volume facility online in 1H’23 and have fulfilled Volvo Cars’ initial requirements for SOP next year by passing Run at Rate. In Q3, we successfully passed the Run at Rate production audit for Volvo Cars at the facility in Mexico leading up to SOP. This is a critical milestone to validate the production capacity and quality requirements for the launch of the upcoming Volvo EX90, and we will scale thereafter to support additional vehicle models at capacity of up to 250k units a year. Volvo Cars also completed installations of our Iris LiDAR onto EX90 vehicles off of the production line at its US plant in Charleston. Year-end Goal: Enter Iris+ C-phase[5]; complete software[6] requirements for Volvo and Mercedes programs; develop a next-gen LiDAR prototype. Status: We remain on track to achieve each of these goals. We have now commenced the process of series production tooling for Iris+ in partnership with TPK, one of the cornerstones of entering C-phase[5]. In Q3, Iris+ continued to undergo optimization and validation testing from its lead series production OEM, which includes design for manufacturability (DFM) updates. We continue to deliver updates on our in-development firmware and software products[6] to our OEM customers. We successfully integrated our software with Volvo and Zenseact’s in-development system and middleware, while also integrating with Mercedes’ data collection vehicles. Luminar has now developed its next-generation LiDAR prototype, and has provided live demonstrations of its improved point cloud performance and new form factor to key OEM customers. More to come on this in the future. In Q3, Luminar’s exclusive insurance partner Swiss Re kicked off an in-depth study to quantify the safety efficacy of Luminar’s technology, as well as the associated insurance savings for consumer vehicles equipped with Luminar products. Year-end Goal: Add at least $1 billion to the Order Book[1]. Status: We remain on track for this goal. We have already experienced growth in our Order Book this year from both new business awards from existing customers, as well as new wins from customers who have decided to upgrade to our LiDAR on their next-generation systems. We expect to continue to aggregate additional wins by the end of the year, which will continue to increase our Order Book, although there is risk some customers may defer formal decisions until early next year. Industrialization & Scale Product & Technology Business Growth Q3’23 Highlights & FY’23 Business Milestones Page 4Q3 2023 Quarterly Business Update Please refer to Footnotes on page 16 for more detail.
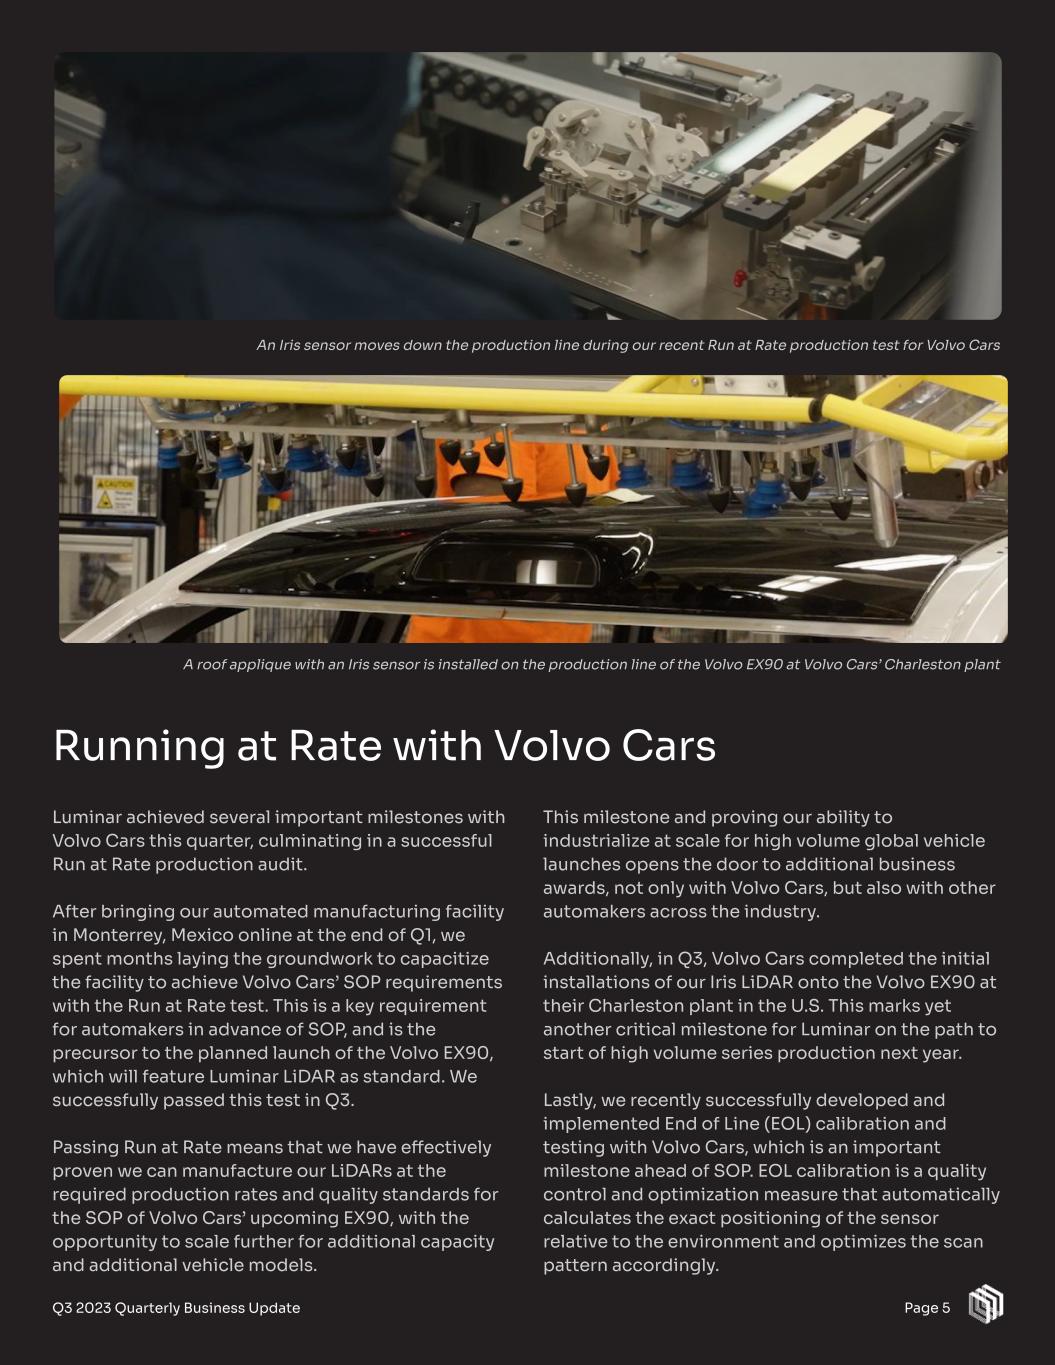
Luminar achieved several important milestones with Volvo Cars this quarter, culminating in a successful Run at Rate production audit. After bringing our automated manufacturing facility in Monterrey, Mexico online at the end of Q1, we spent months laying the groundwork to capacitize the facility to achieve Volvo Cars’ SOP requirements with the Run at Rate test. This is a key requirement for automakers in advance of SOP, and is the precursor to the planned launch of the Volvo EX90, which will feature Luminar LiDAR as standard. We successfully passed this test in Q3. Passing Run at Rate means that we have effectively proven we can manufacture our LiDARs at the required production rates and quality standards for the SOP of Volvo Cars’ upcoming EX90, with the opportunity to scale further for additional capacity and additional vehicle models. Running at Rate with Volvo Cars Page 5Q3 2023 Quarterly Business Update This milestone and proving our ability to industrialize at scale for high volume global vehicle launches opens the door to additional business awards, not only with Volvo Cars, but also with other automakers across the industry. Additionally, in Q3, Volvo Cars completed the initial installations of our Iris LiDAR onto the Volvo EX90 at their Charleston plant in the U.S. This marks yet another critical milestone for Luminar on the path to start of high volume series production next year. Lastly, we recently successfully developed and implemented End of Line (EOL) calibration and testing with Volvo Cars, which is an important milestone ahead of SOP. EOL calibration is a quality control and optimization measure that automatically calculates the exact positioning of the sensor relative to the environment and optimizes the scan pattern accordingly. A roof applique with an Iris sensor is installed on the production line of the Volvo EX90 at Volvo Cars’ Charleston plant An Iris sensor moves down the production line during our recent Run at Rate production test for Volvo Cars
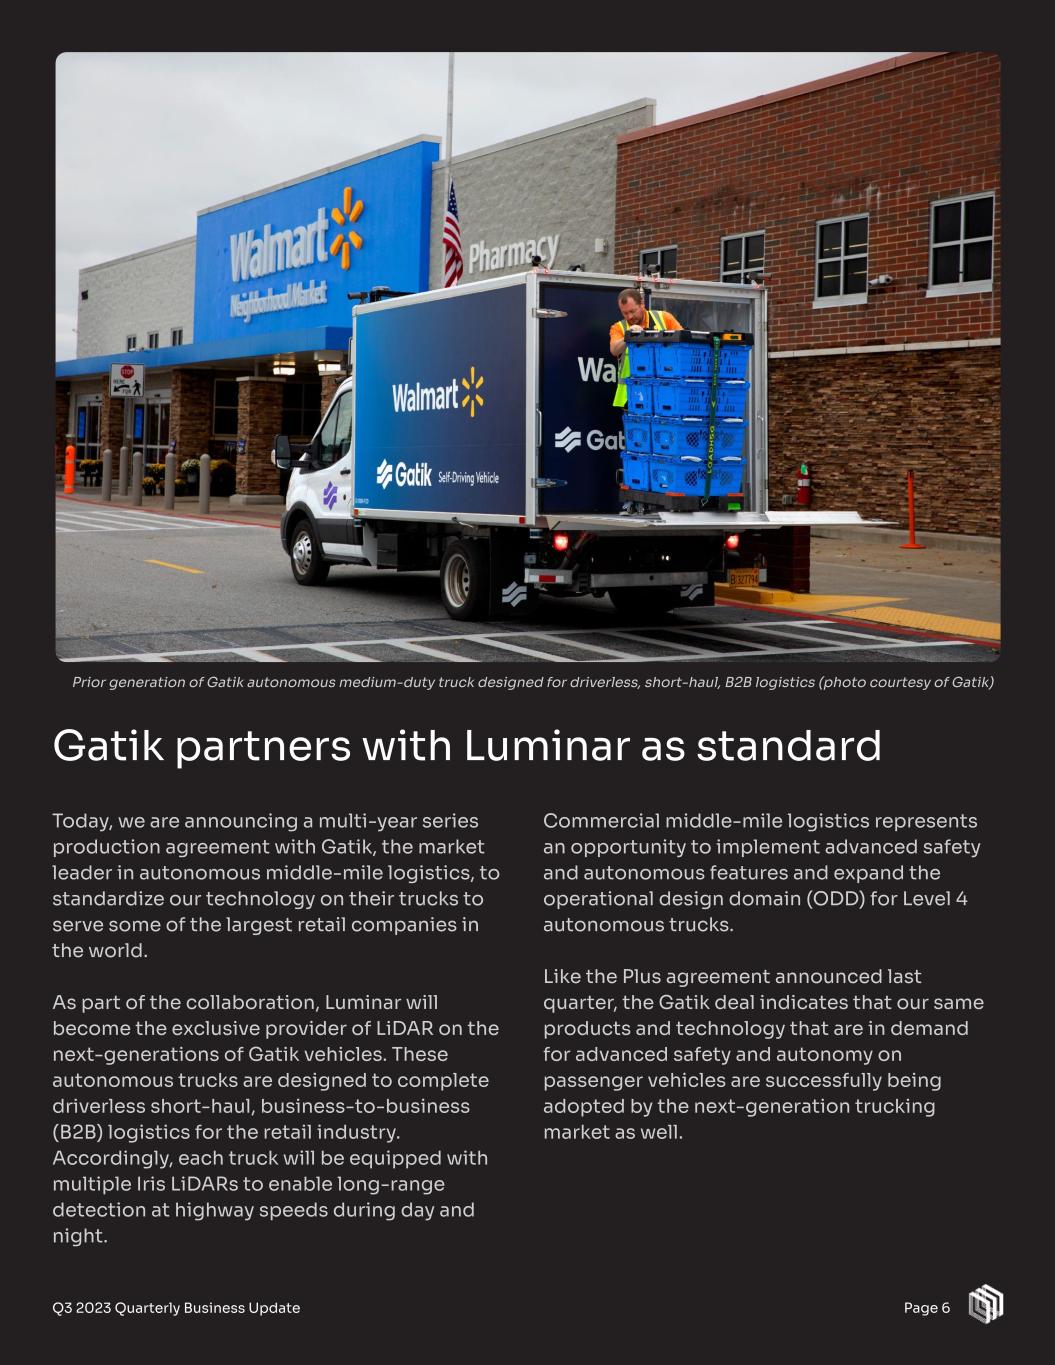
Page 6Q3 2023 Quarterly Business Update Today, we are announcing a multi-year series production agreement with Gatik, the market leader in autonomous middle-mile logistics, to standardize our technology on their trucks to serve some of the largest retail companies in the world. As part of the collaboration, Luminar will become the exclusive provider of LiDAR on the next-generations of Gatik vehicles. These autonomous trucks are designed to complete driverless short-haul, business-to-business (B2B) logistics for the retail industry. Accordingly, each truck will be equipped with multiple Iris LiDARs to enable long-range detection at highway speeds during day and night. Gatik partners with Luminar as standard Prior generation of Gatik autonomous medium-duty truck designed for driverless, short-haul, B2B logistics (photo courtesy of Gatik) Commercial middle-mile logistics represents an opportunity to implement advanced safety and autonomous features and expand the operational design domain (ODD) for Level 4 autonomous trucks. Like the Plus agreement announced last quarter, the Gatik deal indicates that our same products and technology that are in demand for advanced safety and autonomy on passenger vehicles are successfully being adopted by the next-generation trucking market as well.
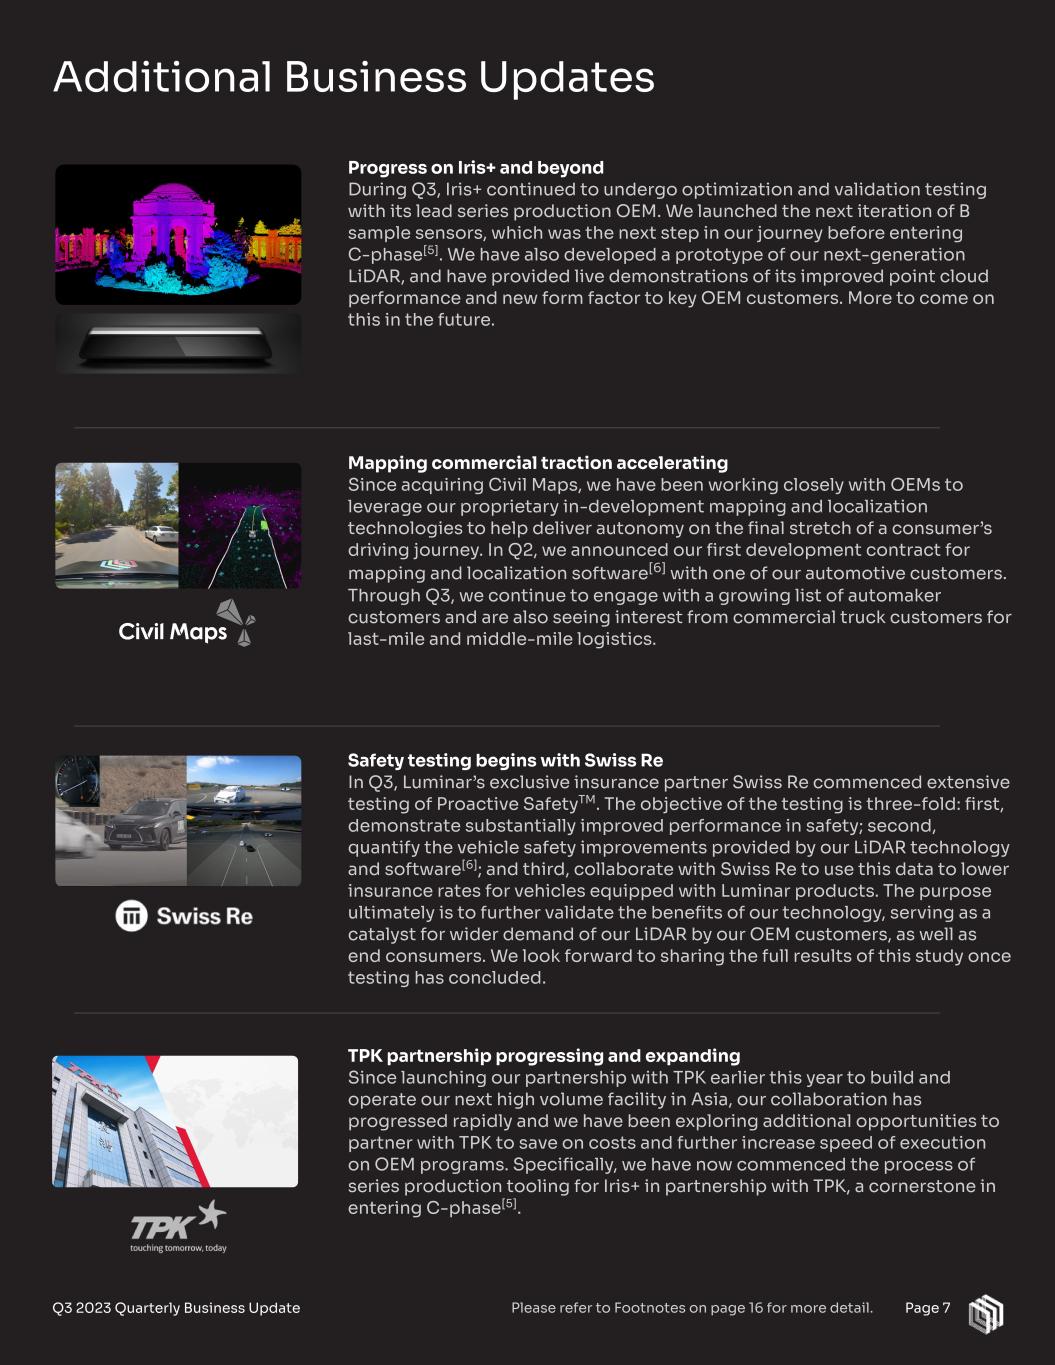
Additional Business Updates Page 7Q3 2023 Quarterly Business Update Progress on Iris+ and beyond During Q3, Iris+ continued to undergo optimization and validation testing with its lead series production OEM. We launched the next iteration of B sample sensors, which was the next step in our journey before entering C-phase[5]. We have also developed a prototype of our next-generation LiDAR, and have provided live demonstrations of its improved point cloud performance and new form factor to key OEM customers. More to come on this in the future. Mapping commercial traction accelerating Since acquiring Civil Maps, we have been working closely with OEMs to leverage our proprietary in-development mapping and localization technologies to help deliver autonomy on the final stretch of a consumer’s driving journey. In Q2, we announced our first development contract for mapping and localization software[6] with one of our automotive customers. Through Q3, we continue to engage with a growing list of automaker customers and are also seeing interest from commercial truck customers for last-mile and middle-mile logistics. Safety testing begins with Swiss Re In Q3, Luminar’s exclusive insurance partner Swiss Re commenced extensive testing of Proactive SafetyTM. The objective of the testing is three-fold: first, demonstrate substantially improved performance in safety; second, quantify the vehicle safety improvements provided by our LiDAR technology and software[6]; and third, collaborate with Swiss Re to use this data to lower insurance rates for vehicles equipped with Luminar products. The purpose ultimately is to further validate the benefits of our technology, serving as a catalyst for wider demand of our LiDAR by our OEM customers, as well as end consumers. We look forward to sharing the full results of this study once testing has concluded. TPK partnership progressing and expanding Since launching our partnership with TPK earlier this year to build and operate our next high volume facility in Asia, our collaboration has progressed rapidly and we have been exploring additional opportunities to partner with TPK to save on costs and further increase speed of execution on OEM programs. Specifically, we have now commenced the process of series production tooling for Iris+ in partnership with TPK, a cornerstone in entering C-phase[5]. Please refer to Footnotes on page 16 for more detail.
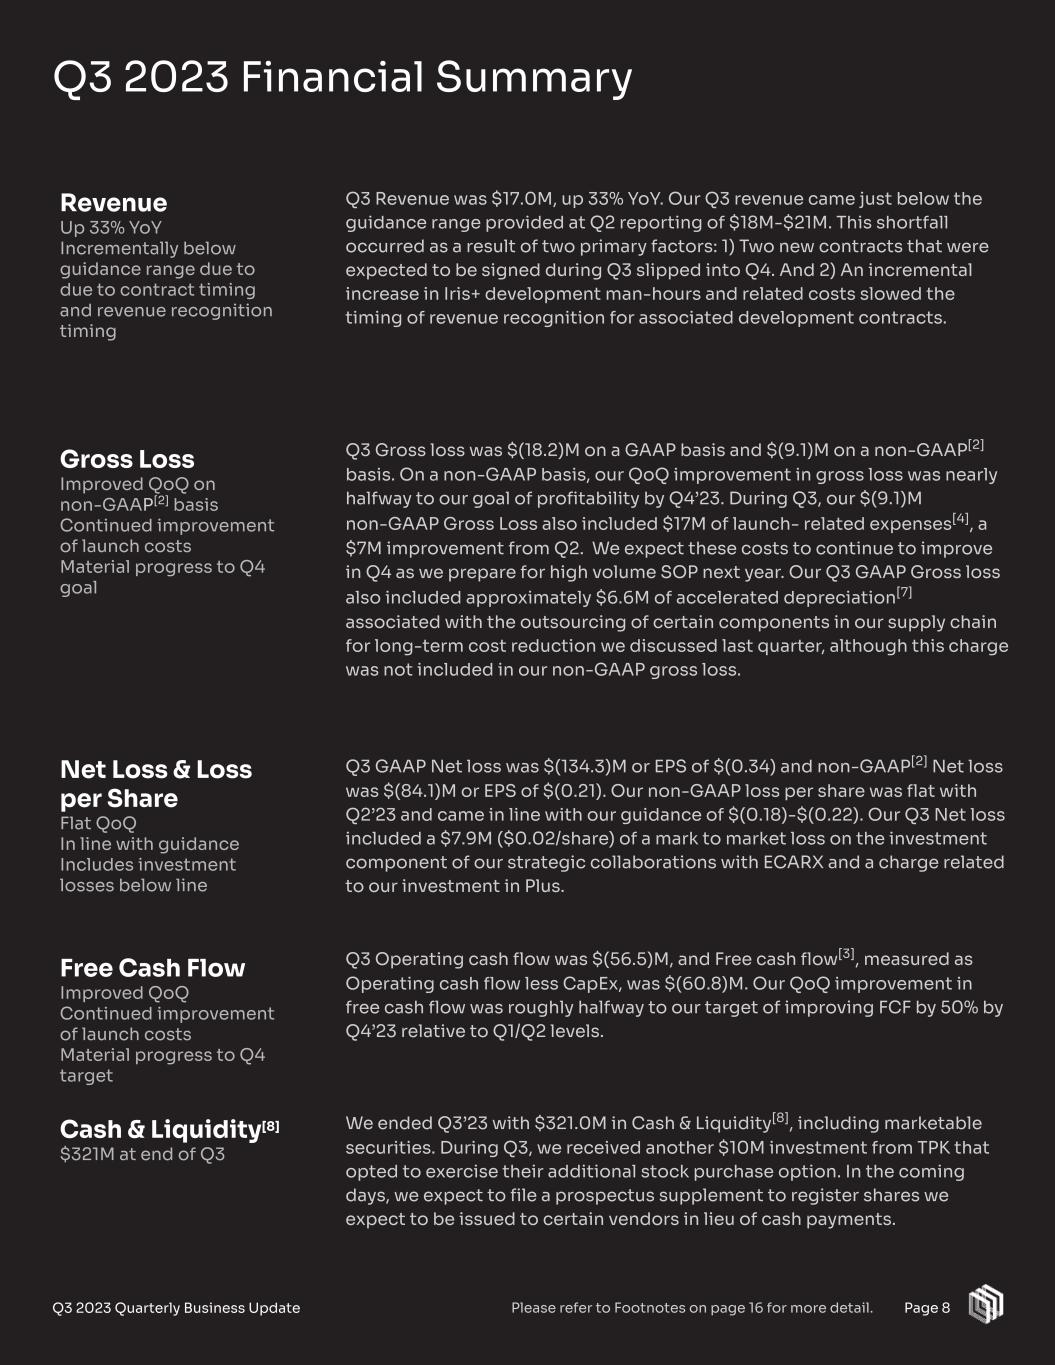
Q3 Revenue was $17.0M, up 33% YoY. Our Q3 revenue came just below the guidance range provided at Q2 reporting of $18M-$21M. This shortfall occurred as a result of two primary factors: 1) Two new contracts that were expected to be signed during Q3 slipped into Q4. And 2) An incremental increase in Iris+ development man-hours and related costs slowed the timing of revenue recognition for associated development contracts. Q3 Gross loss was $(18.2)M on a GAAP basis and $(9.1)M on a non-GAAP[2] basis. On a non-GAAP basis, our QoQ improvement in gross loss was nearly halfway to our goal of profitability by Q4’23. During Q3, our $(9.1)M non-GAAP Gross Loss also included $17M of launch- related expenses[4], a $7M improvement from Q2. We expect these costs to continue to improve in Q4 as we prepare for high volume SOP next year. Our Q3 GAAP Gross loss also included approximately $6.6M of accelerated depreciation[7] associated with the outsourcing of certain components in our supply chain for long-term cost reduction we discussed last quarter, although this charge was not included in our non-GAAP gross loss. Q3 GAAP Net loss was $(134.3)M or EPS of $(0.34) and non-GAAP[2] Net loss was $(84.1)M or EPS of $(0.21). Our non-GAAP loss per share was flat with Q2’23 and came in line with our guidance of $(0.18)-$(0.22). Our Q3 Net loss included a $7.9M ($0.02/share) of a mark to market loss on the investment component of our strategic collaborations with ECARX and a charge related to our investment in Plus. Q3 Operating cash flow was $(56.5)M, and Free cash flow[3], measured as Operating cash flow less CapEx, was $(60.8)M. Our QoQ improvement in free cash flow was roughly halfway to our target of improving FCF by 50% by Q4’23 relative to Q1/Q2 levels. We ended Q3’23 with $321.0M in Cash & Liquidity[8], including marketable securities. During Q3, we received another $10M investment from TPK that opted to exercise their additional stock purchase option. In the coming days, we expect to file a prospectus supplement to register shares we expect to be issued to certain vendors in lieu of cash payments. Q3 2023 Financial Summary 8Q3 2023 Quarterly Business Update Revenue Up 33% YoY Incrementally below guidance range due to due to contract timing and revenue recognition timing Gross Loss Improved QoQ on non-GAAP[2] basis Continued improvement of launch costs Material progress to Q4 goal Net Loss & Loss per Share Flat QoQ In line with guidance Includes investment losses below line Free Cash Flow Improved QoQ Continued improvement of launch costs Material progress to Q4 target Cash & Liquidity[8] $321M at end of Q3 Page 8Please refer to Footnotes on page 16 for more detail.
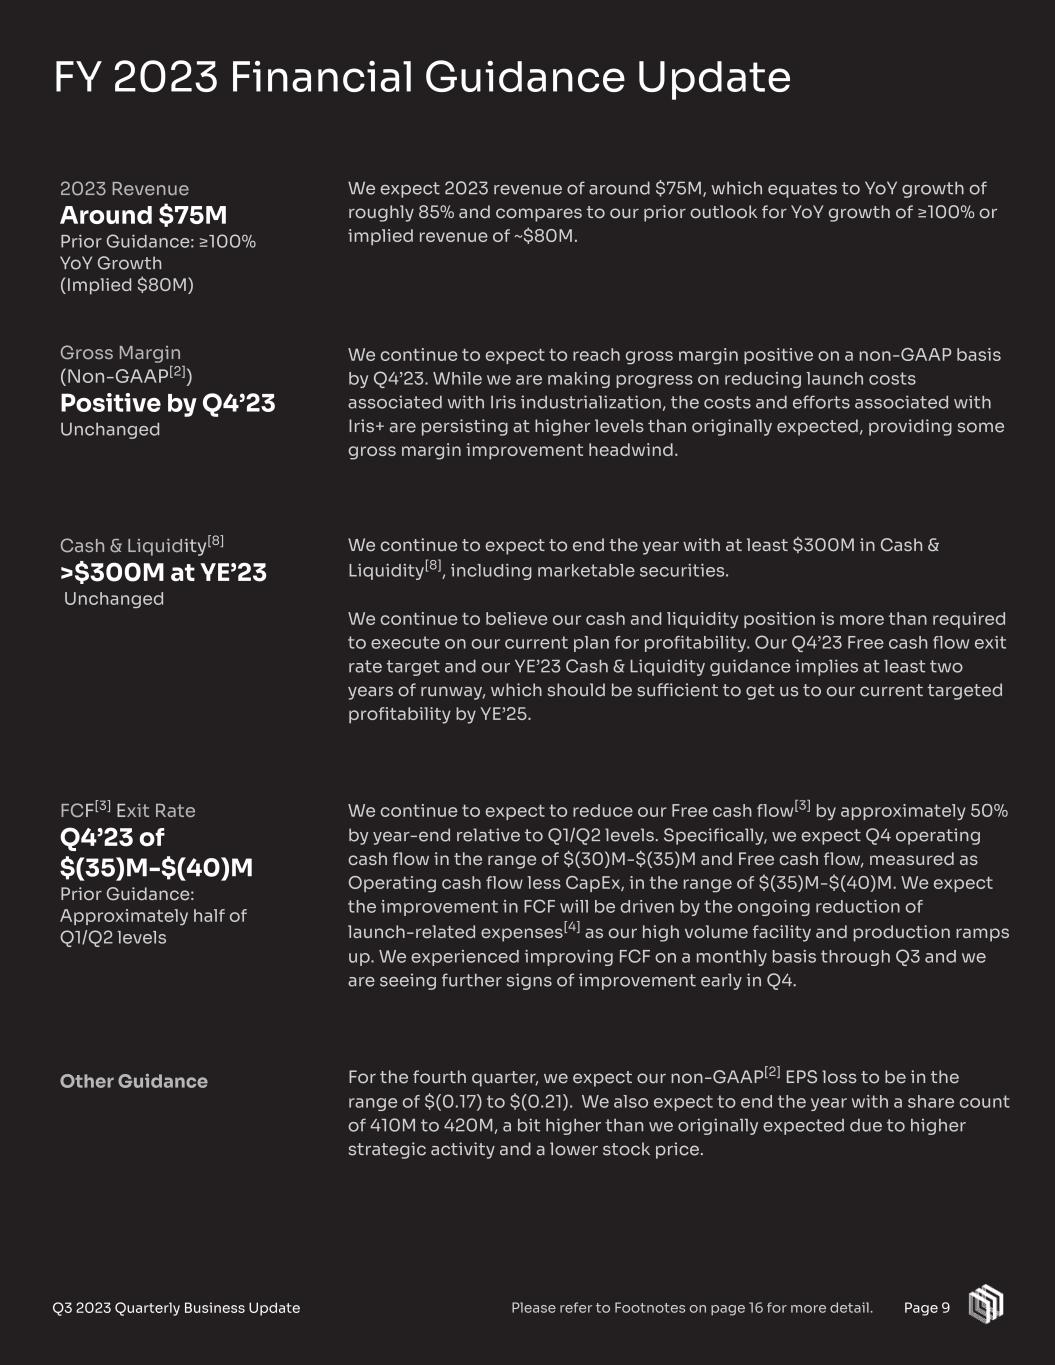
We expect 2023 revenue of around $75M, which equates to YoY growth of roughly 85% and compares to our prior outlook for YoY growth of ≥100% or implied revenue of ~$80M. We continue to expect to reach gross margin positive on a non-GAAP basis by Q4’23. While we are making progress on reducing launch costs associated with Iris industrialization, the costs and efforts associated with Iris+ are persisting at higher levels than originally expected, providing some gross margin improvement headwind. We continue to expect to end the year with at least $300M in Cash & Liquidity[8], including marketable securities. We continue to believe our cash and liquidity position is more than required to execute on our current plan for profitability. Our Q4’23 Free cash flow exit rate target and our YE’23 Cash & Liquidity guidance implies at least two years of runway, which should be sufficient to get us to our current targeted profitability by YE’25. We continue to expect to reduce our Free cash flow[3] by approximately 50% by year-end relative to Q1/Q2 levels. Specifically, we expect Q4 operating cash flow in the range of $(30)M-$(35)M and Free cash flow, measured as Operating cash flow less CapEx, in the range of $(35)M-$(40)M. We expect the improvement in FCF will be driven by the ongoing reduction of launch-related expenses[4] as our high volume facility and production ramps up. We experienced improving FCF on a monthly basis through Q3 and we are seeing further signs of improvement early in Q4. For the fourth quarter, we expect our non-GAAP[2] EPS loss to be in the range of $(0.17) to $(0.21). We also expect to end the year with a share count of 410M to 420M, a bit higher than we originally expected due to higher strategic activity and a lower stock price. FY 2023 Financial Guidance Update Page 9Q3 2023 Quarterly Business Update 2023 Revenue Around $75M Prior Guidance: ≥100% YoY Growth (Implied $80M) Gross Margin (Non-GAAP[2]) Positive by Q4’23 Unchanged Cash & Liquidity[8] >$300M at YE’23 Unchanged FCF[3] Exit Rate Q4’23 of $(35)M-$(40)M Prior Guidance: Approximately half of Q1/Q2 levels Other Guidance Please refer to Footnotes on page 16 for more detail.
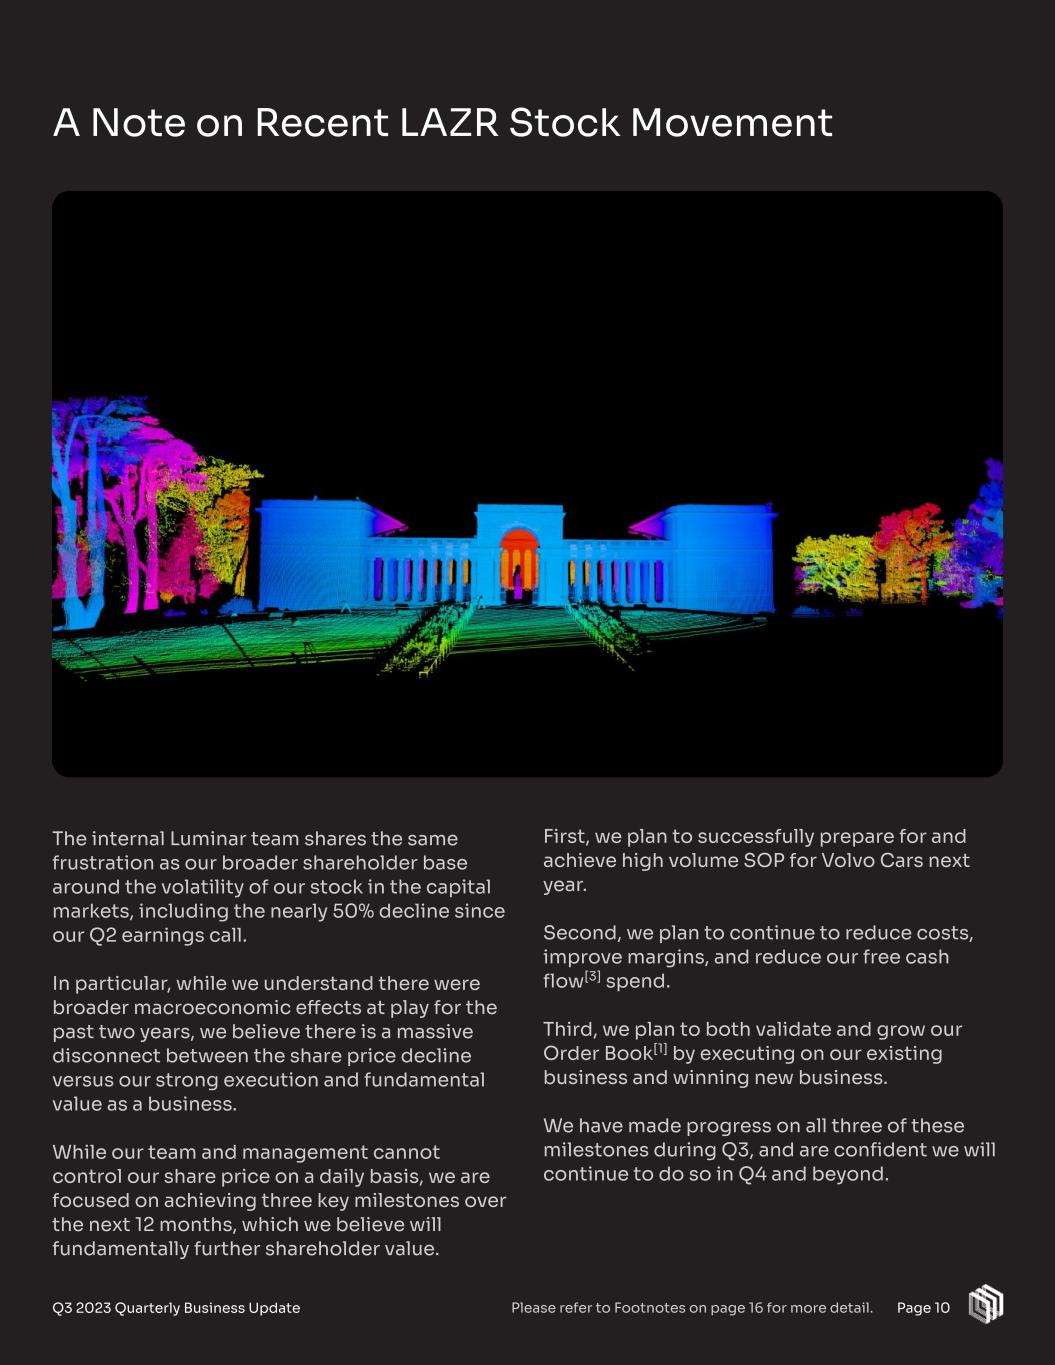
Page 10 A Note on Recent LAZR Stock Movement Q3 2023 Quarterly Business Update The internal Luminar team shares the same frustration as our broader shareholder base around the volatility of our stock in the capital markets, including the nearly 50% decline since our Q2 earnings call. In particular, while we understand there were broader macroeconomic effects at play for the past two years, we believe there is a massive disconnect between the share price decline versus our strong execution and fundamental value as a business. While our team and management cannot control our share price on a daily basis, we are focused on achieving three key milestones over the next 12 months, which we believe will fundamentally further shareholder value. First, we plan to successfully prepare for and achieve high volume SOP for Volvo Cars next year. Second, we plan to continue to reduce costs, improve margins, and reduce our free cash flow[3] spend. Third, we plan to both validate and grow our Order Book[1] by executing on our existing business and winning new business. We have made progress on all three of these milestones during Q3, and are confident we will continue to do so in Q4 and beyond. Please refer to Footnotes on page 16 for more detail.
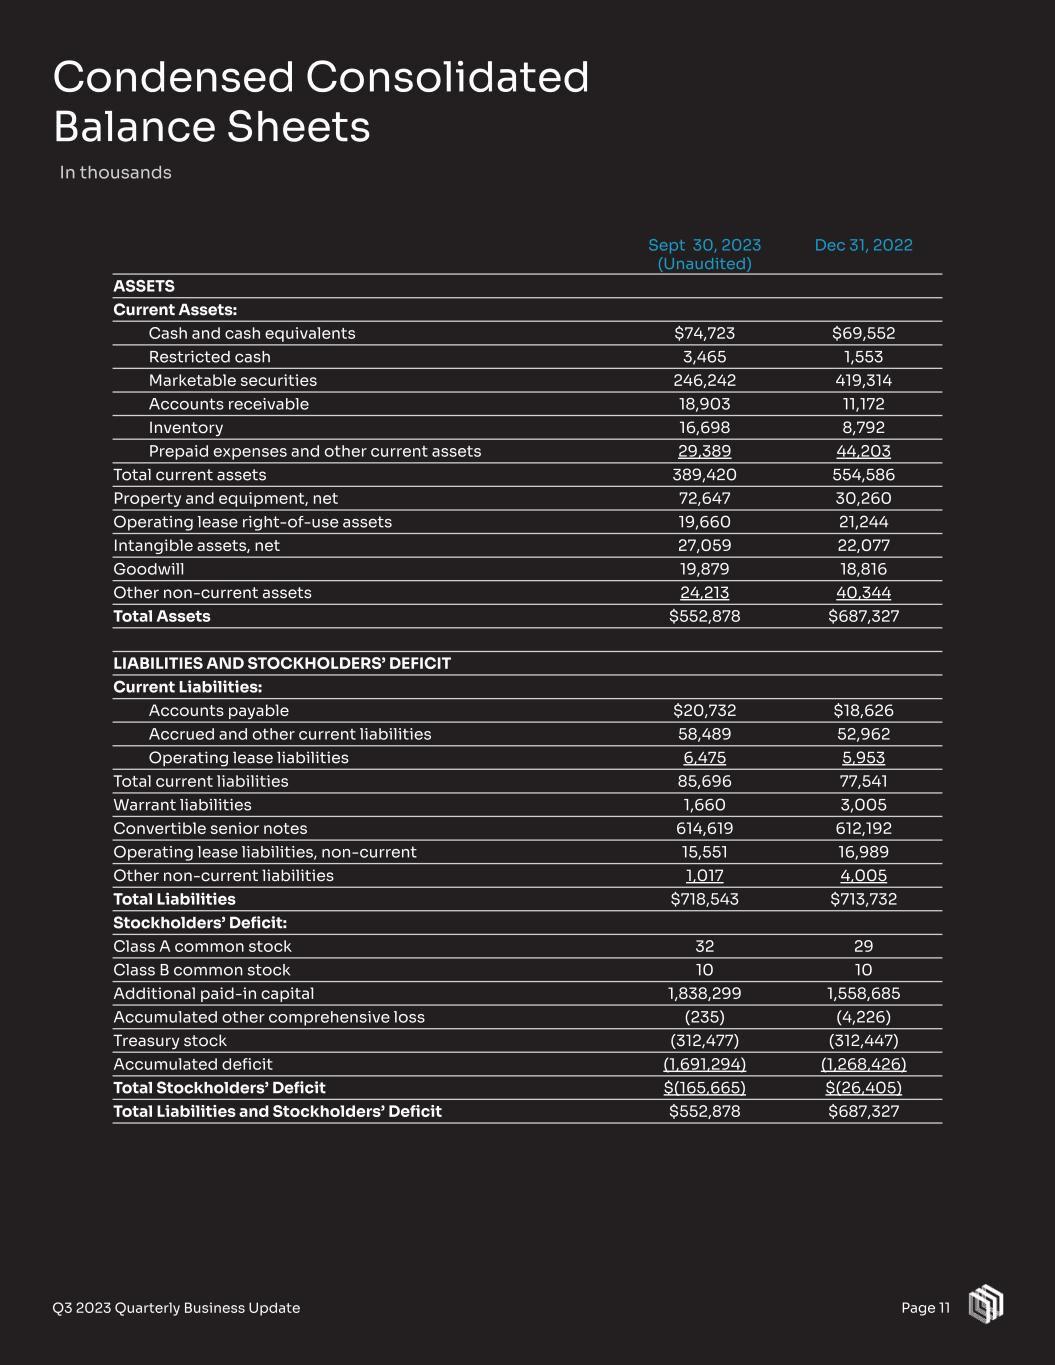
Condensed Consolidated Balance Sheets In thousands Page 11Q3 2023 Quarterly Business Update Sept 30, 2023 (Unaudited) Dec 31, 2022 ASSETS Current Assets: Cash and cash equivalents $74,723 $69,552 Restricted cash 3,465 1,553 Marketable securities 246,242 419,314 Accounts receivable 18,903 11,172 Inventory 16,698 8,792 Prepaid expenses and other current assets 29,389 44,203 Total current assets 389,420 554,586 Property and equipment, net 72,647 30,260 Operating lease right-of-use assets 19,660 21,244 Intangible assets, net 27,059 22,077 Goodwill 19,879 18,816 Other non-current assets 24,213 40,344 Total Assets $552,878 $687,327 LIABILITIES AND STOCKHOLDERS’ DEFICIT Current Liabilities: Accounts payable $20,732 $18,626 Accrued and other current liabilities 58,489 52,962 Operating lease liabilities 6,475 5,953 Total current liabilities 85,696 77,541 Warrant liabilities 1,660 3,005 Convertible senior notes 614,619 612,192 Operating lease liabilities, non-current 15,551 16,989 Other non-current liabilities 1,017 4,005 Total Liabilities $718,543 $713,732 Stockholders’ Deficit: Class A common stock 32 29 Class B common stock 10 10 Additional paid-in capital 1,838,299 1,558,685 Accumulated other comprehensive loss (235) (4,226) Treasury stock (312,477) (312,447) Accumulated deficit (1,691,294) (1,268,426) Total Stockholders’ Deficit $(165,665) $(26,405) Total Liabilities and Stockholders’ Deficit $552,878 $687,327
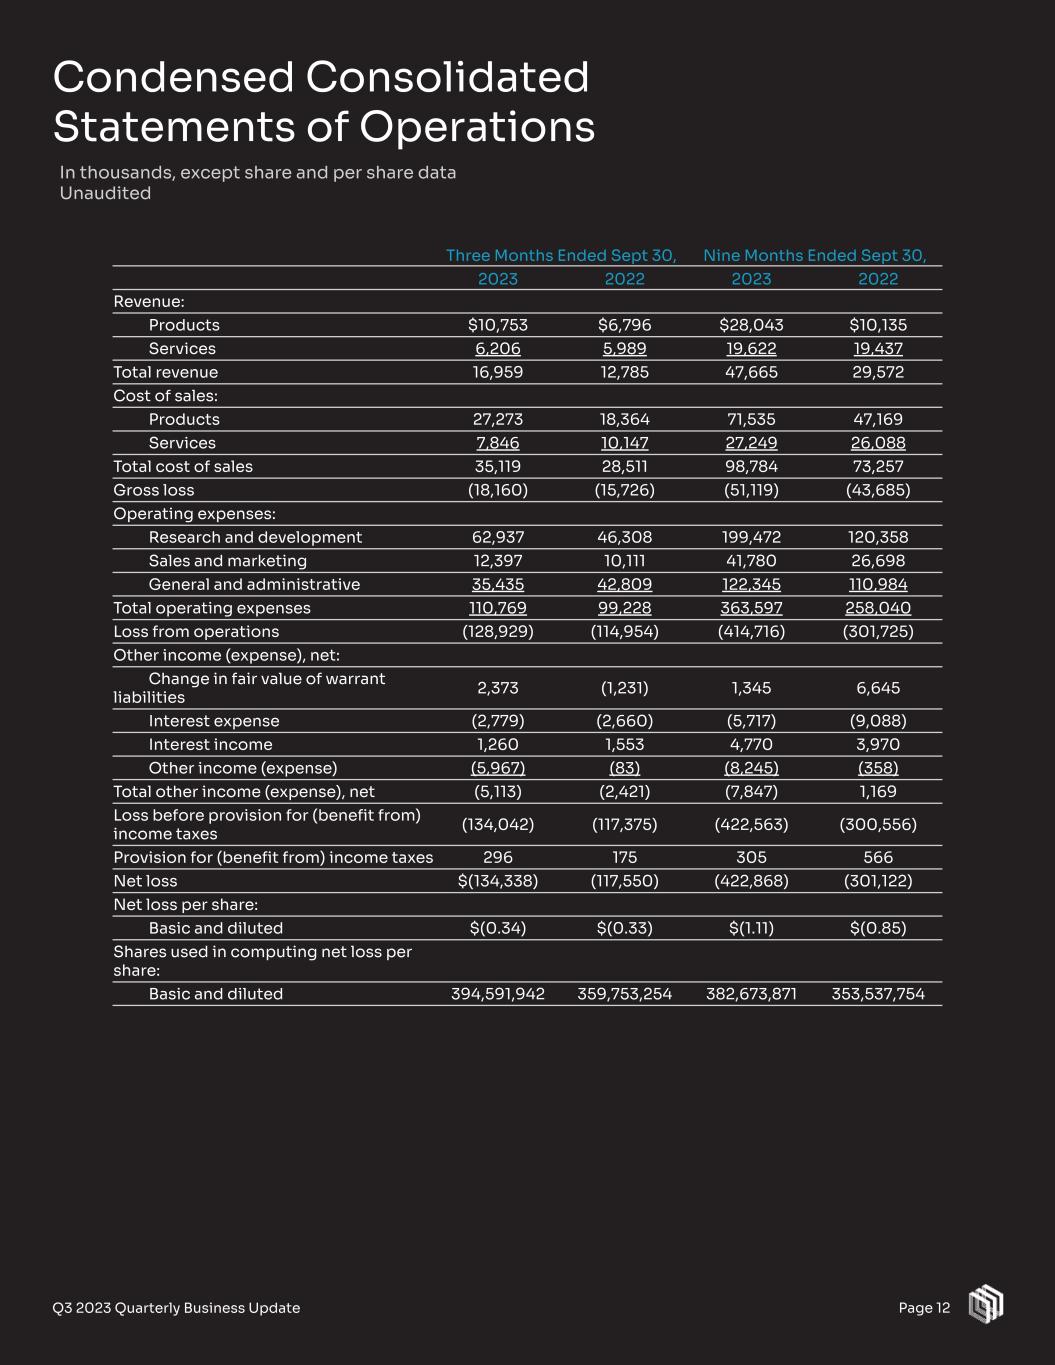
Condensed Consolidated Statements of Operations Page 12Q3 2023 Quarterly Business Update Three Months Ended Sept 30, Nine Months Ended Sept 30, 2023 2022 2023 2022 Revenue: Products $10,753 $6,796 $28,043 $10,135 Services 6,206 5,989 19,622 19,437 Total revenue 16,959 12,785 47,665 29,572 Cost of sales: Products 27,273 18,364 71,535 47,169 Services 7,846 10,147 27,249 26,088 Total cost of sales 35,119 28,511 98,784 73,257 Gross loss (18,160) (15,726) (51,119) (43,685) Operating expenses: Research and development 62,937 46,308 199,472 120,358 Sales and marketing 12,397 10,111 41,780 26,698 General and administrative 35,435 42,809 122,345 110,984 Total operating expenses 110,769 99,228 363,597 258,040 Loss from operations (128,929) (114,954) (414,716) (301,725) Other income (expense), net: Change in fair value of warrant liabilities 2,373 (1,231) 1,345 6,645 Interest expense (2,779) (2,660) (5,717) (9,088) Interest income 1,260 1,553 4,770 3,970 Other income (expense) (5,967) (83) (8,245) (358) Total other income (expense), net (5,113) (2,421) (7,847) 1,169 Loss before provision for (benefit from) income taxes (134,042) (117,375) (422,563) (300,556) Provision for (benefit from) income taxes 296 175 305 566 Net loss $(134,338) (117,550) (422,868) (301,122) Net loss per share: Basic and diluted $(0.34) $(0.33) $(1.11) $(0.85) Shares used in computing net loss per share: Basic and diluted 394,591,942 359,753,254 382,673,871 353,537,754 In thousands, except share and per share data Unaudited
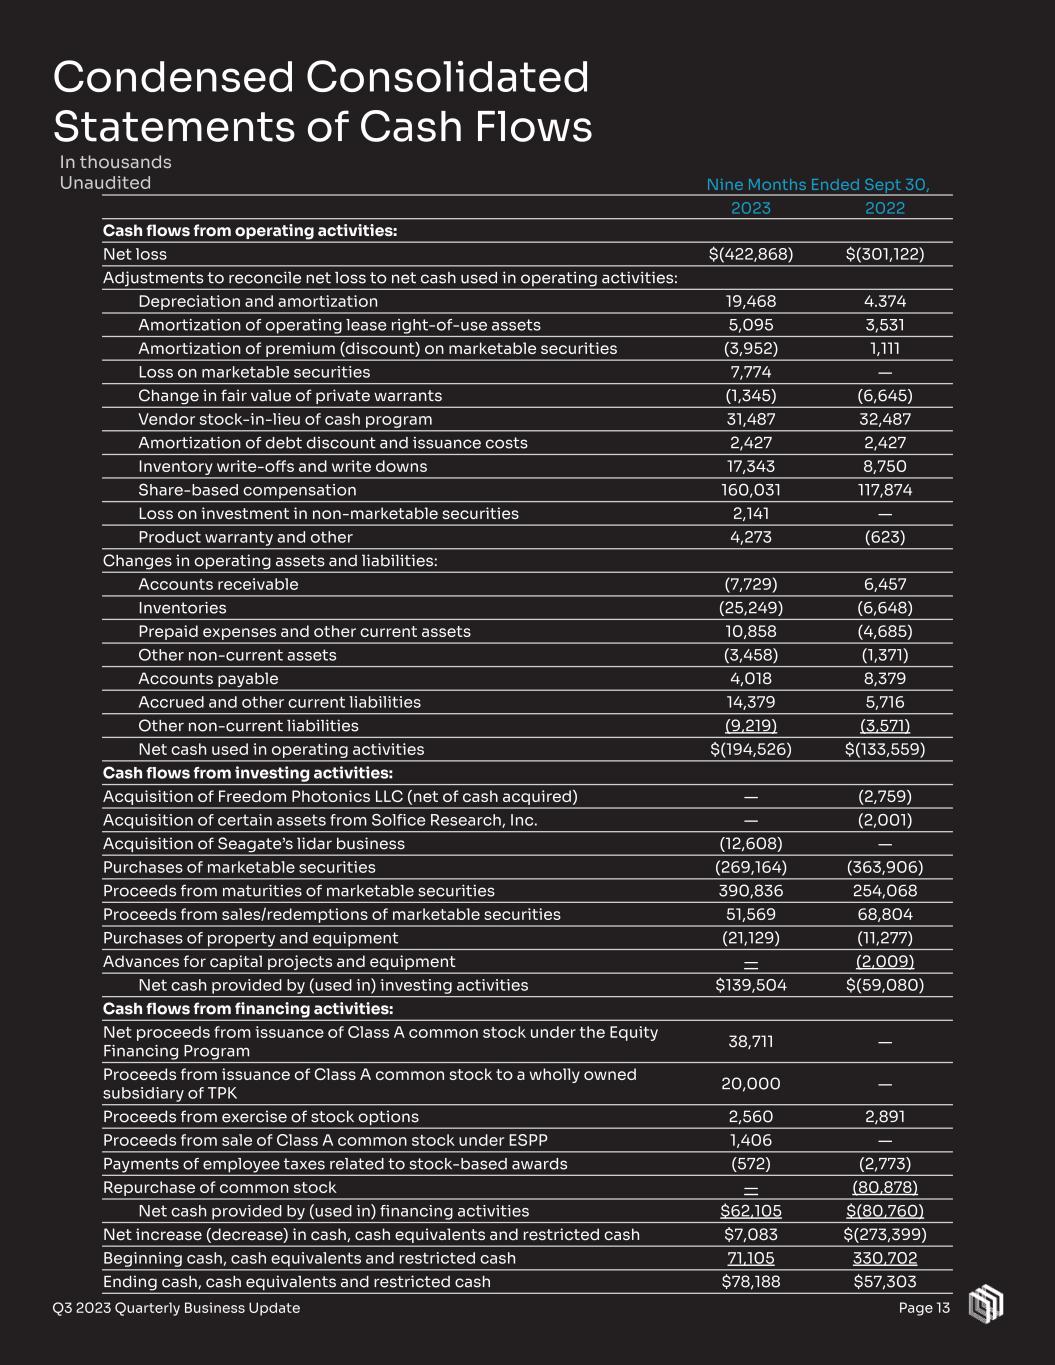
Condensed Consolidated Statements of Cash Flows Page 13Q3 2023 Quarterly Business Update In thousands Unaudited Nine Months Ended Sept 30, 2023 2022 Cash flows from operating activities: Net loss $(422,868) $(301,122) Adjustments to reconcile net loss to net cash used in operating activities: Depreciation and amortization 19,468 4.374 Amortization of operating lease right-of-use assets 5,095 3,531 Amortization of premium (discount) on marketable securities (3,952) 1,111 Loss on marketable securities 7,774 — Change in fair value of private warrants (1,345) (6,645) Vendor stock-in-lieu of cash program 31,487 32,487 Amortization of debt discount and issuance costs 2,427 2,427 Inventory write-offs and write downs 17,343 8,750 Share-based compensation 160,031 117,874 Loss on investment in non-marketable securities 2,141 — Product warranty and other 4,273 (623) Changes in operating assets and liabilities: Accounts receivable (7,729) 6,457 Inventories (25,249) (6,648) Prepaid expenses and other current assets 10,858 (4,685) Other non-current assets (3,458) (1,371) Accounts payable 4,018 8,379 Accrued and other current liabilities 14,379 5,716 Other non-current liabilities (9,219) (3,571) Net cash used in operating activities $(194,526) $(133,559) Cash flows from investing activities: Acquisition of Freedom Photonics LLC (net of cash acquired) — (2,759) Acquisition of certain assets from Solfice Research, Inc. — (2,001) Acquisition of Seagate’s lidar business (12,608) — Purchases of marketable securities (269,164) (363,906) Proceeds from maturities of marketable securities 390,836 254,068 Proceeds from sales/redemptions of marketable securities 51,569 68,804 Purchases of property and equipment (21,129) (11,277) Advances for capital projects and equipment — (2,009) Net cash provided by (used in) investing activities $139,504 $(59,080) Cash flows from financing activities: Net proceeds from issuance of Class A common stock under the Equity Financing Program 38,711 — Proceeds from issuance of Class A common stock to a wholly owned subsidiary of TPK 20,000 — Proceeds from exercise of stock options 2,560 2,891 Proceeds from sale of Class A common stock under ESPP 1,406 — Payments of employee taxes related to stock-based awards (572) (2,773) Repurchase of common stock — (80,878) Net cash provided by (used in) financing activities $62,105 $(80,760) Net increase (decrease) in cash, cash equivalents and restricted cash $7,083 $(273,399) Beginning cash, cash equivalents and restricted cash 71,105 330,702 Ending cash, cash equivalents and restricted cash $78,188 $57,303
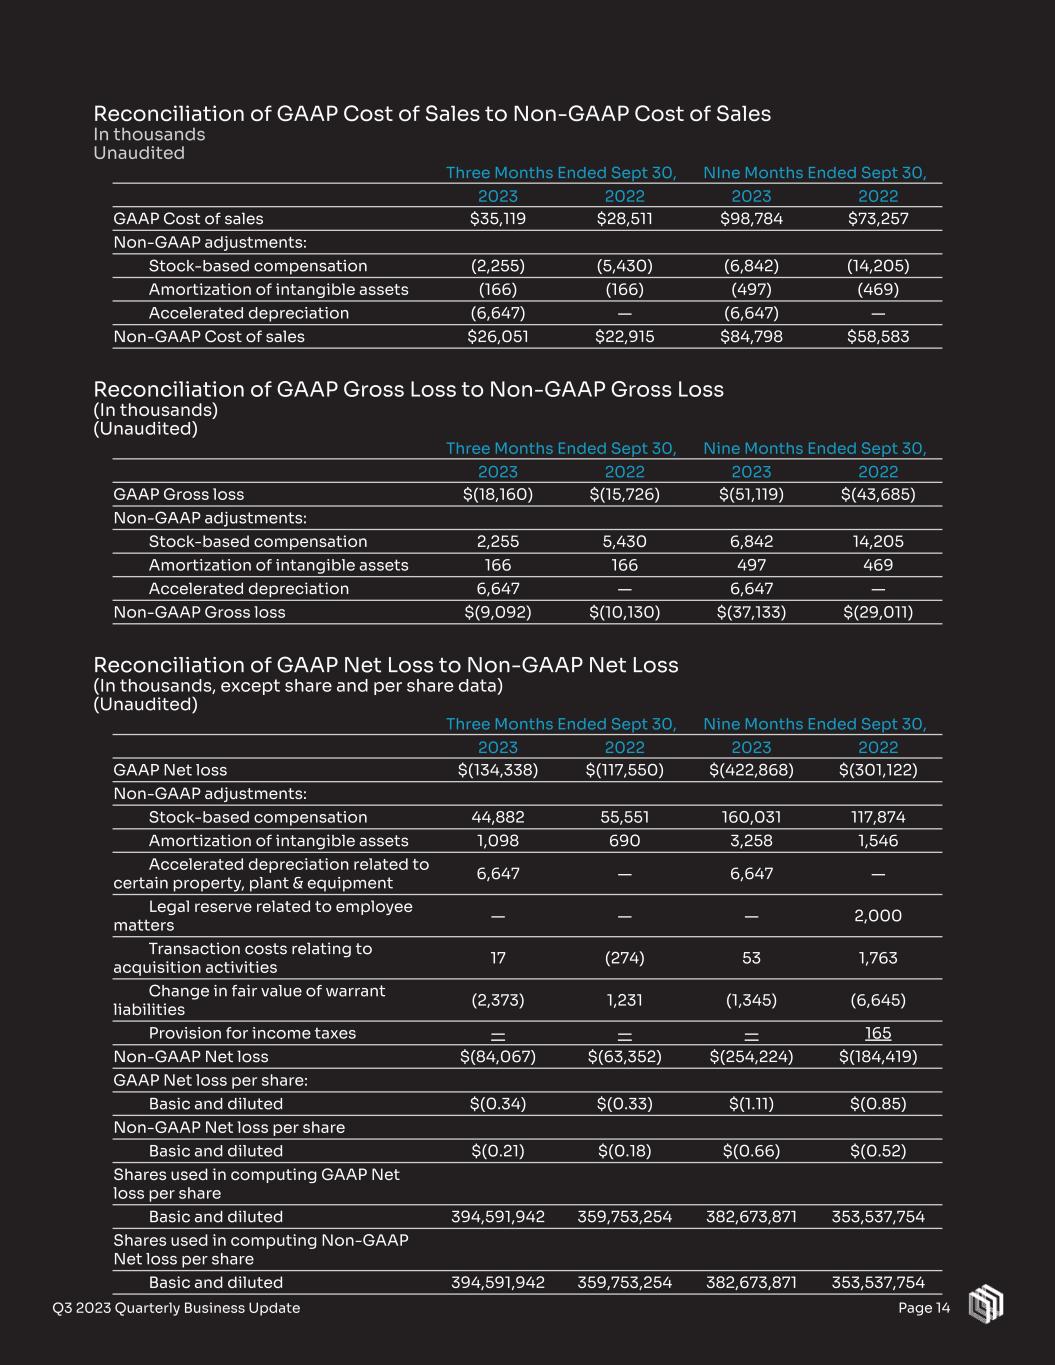
Page 14Q3 2023 Quarterly Business Update Reconciliation of GAAP Cost of Sales to Non-GAAP Cost of Sales In thousands Unaudited Three Months Ended Sept 30, NIne Months Ended Sept 30, 2023 2022 2023 2022 GAAP Cost of sales $35,119 $28,511 $98,784 $73,257 Non-GAAP adjustments: Stock-based compensation (2,255) (5,430) (6,842) (14,205) Amortization of intangible assets (166) (166) (497) (469) Accelerated depreciation (6,647) — (6,647) — Non-GAAP Cost of sales $26,051 $22,915 $84,798 $58,583 Reconciliation of GAAP Gross Loss to Non-GAAP Gross Loss (In thousands) (Unaudited) Three Months Ended Sept 30, Nine Months Ended Sept 30, 2023 2022 2023 2022 GAAP Gross loss $(18,160) $(15,726) $(51,119) $(43,685) Non-GAAP adjustments: Stock-based compensation 2,255 5,430 6,842 14,205 Amortization of intangible assets 166 166 497 469 Accelerated depreciation 6,647 — 6,647 — Non-GAAP Gross loss $(9,092) $(10,130) $(37,133) $(29,011) Reconciliation of GAAP Net Loss to Non-GAAP Net Loss (In thousands, except share and per share data) (Unaudited) Three Months Ended Sept 30, Nine Months Ended Sept 30, 2023 2022 2023 2022 GAAP Net loss $(134,338) $(117,550) $(422,868) $(301,122) Non-GAAP adjustments: Stock-based compensation 44,882 55,551 160,031 117,874 Amortization of intangible assets 1,098 690 3,258 1,546 Accelerated depreciation related to certain property, plant & equipment 6,647 — 6,647 — Legal reserve related to employee matters — — — 2,000 Transaction costs relating to acquisition activities 17 (274) 53 1,763 Change in fair value of warrant liabilities (2,373) 1,231 (1,345) (6,645) Provision for income taxes — — — 165 Non-GAAP Net loss $(84,067) $(63,352) $(254,224) $(184,419) GAAP Net loss per share: Basic and diluted $(0.34) $(0.33) $(1.11) $(0.85) Non-GAAP Net loss per share Basic and diluted $(0.21) $(0.18) $(0.66) $(0.52) Shares used in computing GAAP Net loss per share Basic and diluted 394,591,942 359,753,254 382,673,871 353,537,754 Shares used in computing Non-GAAP Net loss per share Basic and diluted 394,591,942 359,753,254 382,673,871 353,537,754
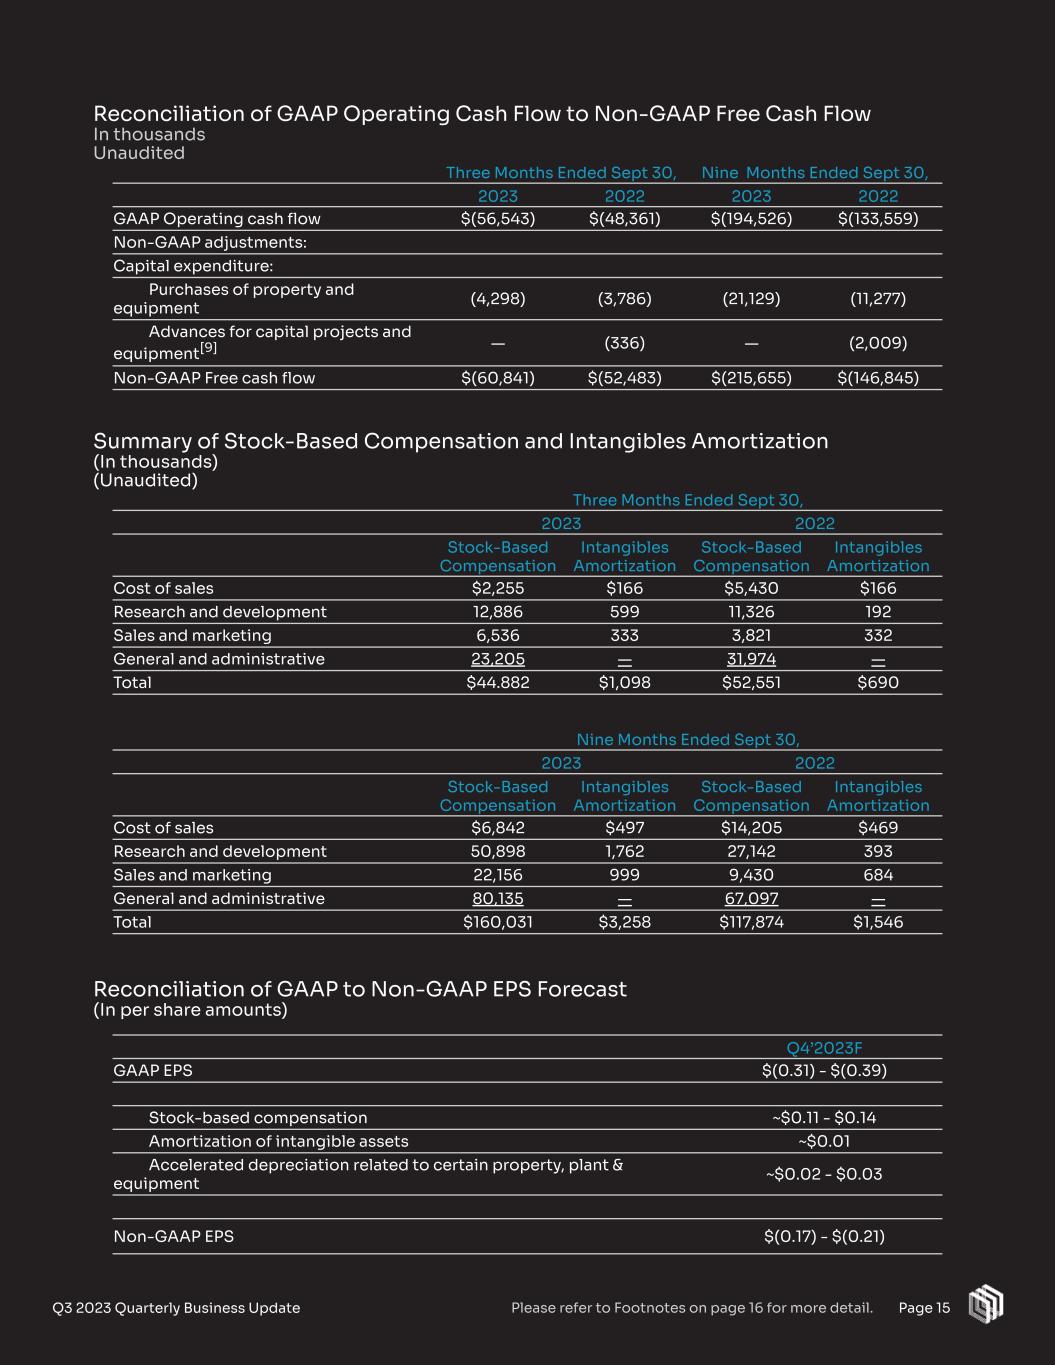
Page 15Q3 2023 Quarterly Business Update Reconciliation of GAAP Operating Cash Flow to Non-GAAP Free Cash Flow In thousands Unaudited Summary of Stock-Based Compensation and Intangibles Amortization (In thousands) (Unaudited) Three Months Ended Sept 30, Nine Months Ended Sept 30, 2023 2022 2023 2022 GAAP Operating cash flow $(56,543) $(48,361) $(194,526) $(133,559) Non-GAAP adjustments: Capital expenditure: Purchases of property and equipment (4,298) (3,786) (21,129) (11,277) Advances for capital projects and equipment[9] — (336) — (2,009) Non-GAAP Free cash flow $(60,841) $(52,483) $(215,655) $(146,845) Three Months Ended Sept 30, 2023 2022 Stock-Based Compensation Intangibles Amortization Stock-Based Compensation Intangibles Amortization Cost of sales $2,255 $166 $5,430 $166 Research and development 12,886 599 11,326 192 Sales and marketing 6,536 333 3,821 332 General and administrative 23,205 — 31,974 — Total $44.882 $1,098 $52,551 $690 Nine Months Ended Sept 30, 2023 2022 Stock-Based Compensation Intangibles Amortization Stock-Based Compensation Intangibles Amortization Cost of sales $6,842 $497 $14,205 $469 Research and development 50,898 1,762 27,142 393 Sales and marketing 22,156 999 9,430 684 General and administrative 80,135 — 67,097 — Total $160,031 $3,258 $117,874 $1,546 Reconciliation of GAAP to Non-GAAP EPS Forecast (In per share amounts) Q4’2023F GAAP EPS $(0.31) - $(0.39) Stock-based compensation ~$0.11 - $0.14 Amortization of intangible assets ~$0.01 Accelerated depreciation related to certain property, plant & equipment ~$0.02 - $0.03 Non-GAAP EPS $(0.17) - $(0.21) Please refer to Footnotes on page 16 for more detail.
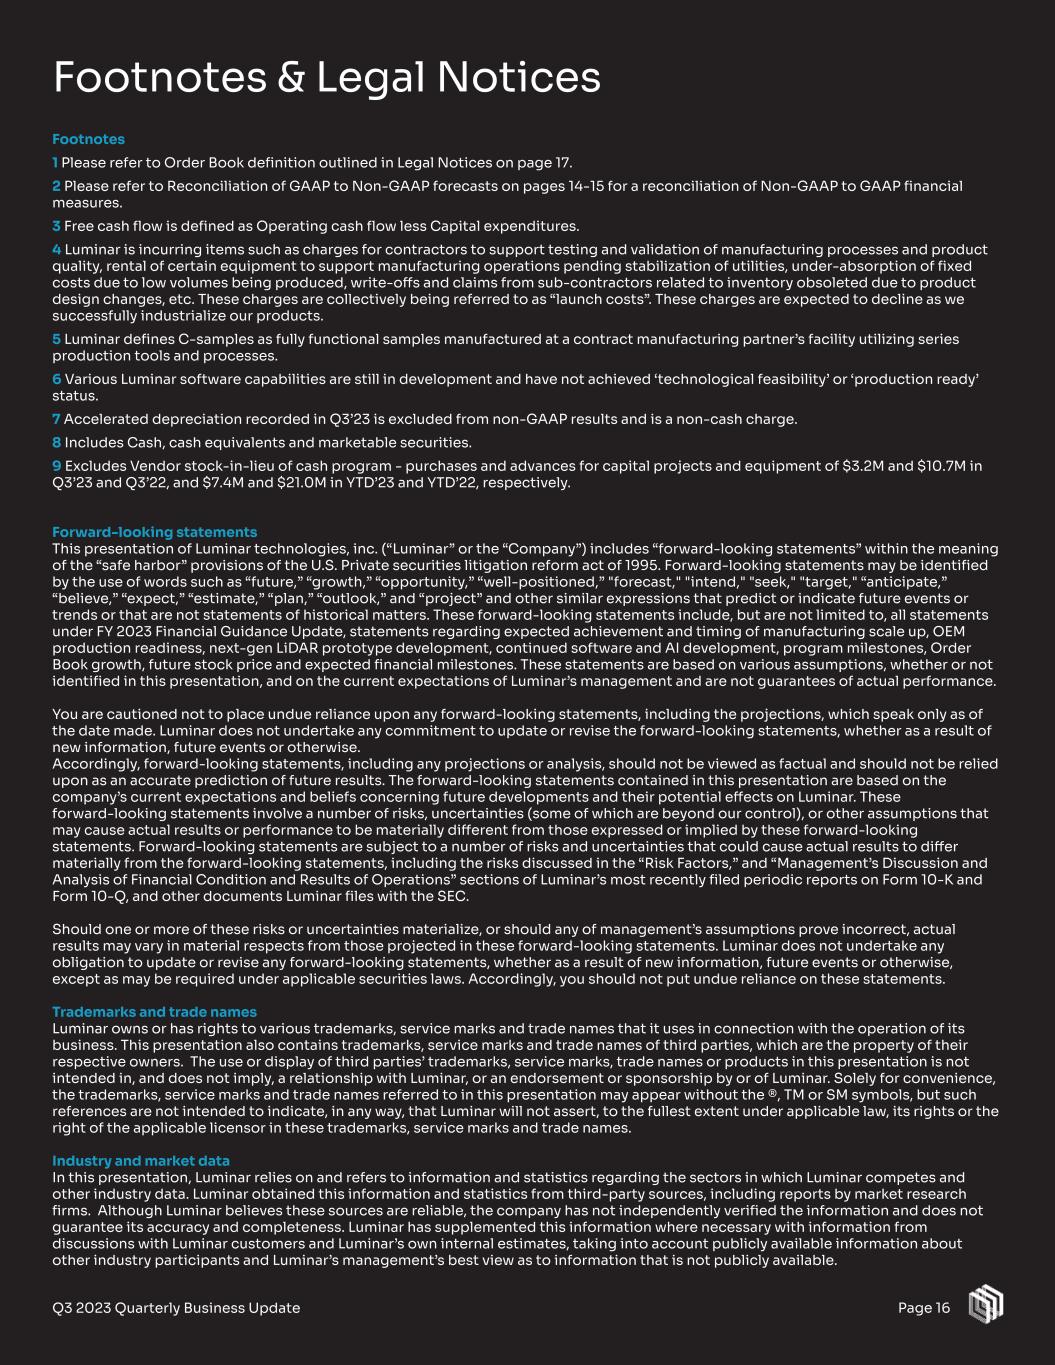
Page 16Q3 2023 Quarterly Business Update Footnotes & Legal Notices Footnotes 1 Please refer to Order Book definition outlined in Legal Notices on page 17. 2 Please refer to Reconciliation of GAAP to Non-GAAP forecasts on pages 14-15 for a reconciliation of Non-GAAP to GAAP financial measures. 3 Free cash flow is defined as Operating cash flow less Capital expenditures. 4 Luminar is incurring items such as charges for contractors to support testing and validation of manufacturing processes and product quality, rental of certain equipment to support manufacturing operations pending stabilization of utilities, under-absorption of fixed costs due to low volumes being produced, write-offs and claims from sub-contractors related to inventory obsoleted due to product design changes, etc. These charges are collectively being referred to as “launch costs”. These charges are expected to decline as we successfully industrialize our products. 5 Luminar defines C-samples as fully functional samples manufactured at a contract manufacturing partner’s facility utilizing series production tools and processes. 6 Various Luminar software capabilities are still in development and have not achieved ‘technological feasibility’ or ‘production ready’ status. 7 Accelerated depreciation recorded in Q3’23 is excluded from non-GAAP results and is a non-cash charge. 8 Includes Cash, cash equivalents and marketable securities. 9 Excludes Vendor stock-in-lieu of cash program - purchases and advances for capital projects and equipment of $3.2M and $10.7M in Q3’23 and Q3’22, and $7.4M and $21.0M in YTD’23 and YTD’22, respectively. Forward-looking statements This presentation of Luminar technologies, inc. (“Luminar” or the “Company”) includes “forward-looking statements” within the meaning of the “safe harbor” provisions of the U.S. Private securities litigation reform act of 1995. Forward-looking statements may be identified by the use of words such as “future,” “growth,” “opportunity,” “well-positioned,” "forecast," "intend," "seek," "target," “anticipate,” “believe,” “expect,” “estimate,” “plan,” “outlook,” and “project” and other similar expressions that predict or indicate future events or trends or that are not statements of historical matters. These forward-looking statements include, but are not limited to, all statements under FY 2023 Financial Guidance Update, statements regarding expected achievement and timing of manufacturing scale up, OEM production readiness, next-gen LiDAR prototype development, continued software and AI development, program milestones, Order Book growth, future stock price and expected financial milestones. These statements are based on various assumptions, whether or not identified in this presentation, and on the current expectations of Luminar’s management and are not guarantees of actual performance. You are cautioned not to place undue reliance upon any forward-looking statements, including the projections, which speak only as of the date made. Luminar does not undertake any commitment to update or revise the forward-looking statements, whether as a result of new information, future events or otherwise. Accordingly, forward-looking statements, including any projections or analysis, should not be viewed as factual and should not be relied upon as an accurate prediction of future results. The forward-looking statements contained in this presentation are based on the company’s current expectations and beliefs concerning future developments and their potential effects on Luminar. These forward-looking statements involve a number of risks, uncertainties (some of which are beyond our control), or other assumptions that may cause actual results or performance to be materially different from those expressed or implied by these forward-looking statements. Forward-looking statements are subject to a number of risks and uncertainties that could cause actual results to differ materially from the forward-looking statements, including the risks discussed in the “Risk Factors,” and “Management’s Discussion and Analysis of Financial Condition and Results of Operations” sections of Luminar’s most recently filed periodic reports on Form 10-K and Form 10-Q, and other documents Luminar files with the SEC. Should one or more of these risks or uncertainties materialize, or should any of management’s assumptions prove incorrect, actual results may vary in material respects from those projected in these forward-looking statements. Luminar does not undertake any obligation to update or revise any forward-looking statements, whether as a result of new information, future events or otherwise, except as may be required under applicable securities laws. Accordingly, you should not put undue reliance on these statements. Trademarks and trade names Luminar owns or has rights to various trademarks, service marks and trade names that it uses in connection with the operation of its business. This presentation also contains trademarks, service marks and trade names of third parties, which are the property of their respective owners. The use or display of third parties’ trademarks, service marks, trade names or products in this presentation is not intended in, and does not imply, a relationship with Luminar, or an endorsement or sponsorship by or of Luminar. Solely for convenience, the trademarks, service marks and trade names referred to in this presentation may appear without the ®, TM or SM symbols, but such references are not intended to indicate, in any way, that Luminar will not assert, to the fullest extent under applicable law, its rights or the right of the applicable licensor in these trademarks, service marks and trade names. Industry and market data In this presentation, Luminar relies on and refers to information and statistics regarding the sectors in which Luminar competes and other industry data. Luminar obtained this information and statistics from third-party sources, including reports by market research firms. Although Luminar believes these sources are reliable, the company has not independently verified the information and does not guarantee its accuracy and completeness. Luminar has supplemented this information where necessary with information from discussions with Luminar customers and Luminar’s own internal estimates, taking into account publicly available information about other industry participants and Luminar’s management’s best view as to information that is not publicly available.

Page 17Q3 2023 Quarterly Business Update Legal Notices Use of non-GAAP financial measures In addition to disclosing financial measures prepared in accordance with U.S. generally accepted accounting principles (GAAP), this presentation contains certain non-GAAP financial measures and certain other metrics. Non-GAAP financial measures and these other metrics do not have any standardized meaning and are therefore unlikely to be comparable to similarly titled measures and metrics presented by other companies. Luminar considers these non-GAAP financial measures and metrics to be important because they provide useful measures of the operating performance of the Company, exclusive of factors that do not directly affect what we consider to be our core operating performance, as well as unusual events. The Company’s management uses these measures and metrics to (i) illustrate underlying trends in the Company’s business that could otherwise be masked by the effect of income or expenses that are excluded from non-GAAP measures, and (ii) establish budgets and operational goals for managing the Company’s business and evaluating its performance. In addition, investors often use similar measures to evaluate the operating performance of a company. Non-GAAP financial measures and metrics are presented only as supplemental information for purposes of understanding the Company’s operating results. The non-GAAP financial measures and metrics should not be considered a substitute for financial information presented in accordance with GAAP. This presentation includes non-GAAP financial measures, including non-GAAP cost of sales, gross loss/gross profit, net loss and Free Cash Flow. Non-GAAP cost of sales is defined as GAAP cost of sales adjusted for stock-based compensation expense, amortization of intangible assets, and accelerated depreciation related to certain property, plant and equipment items. Non-GAAP gross loss/gross profit is defined as GAAP gross loss/gross profit adjusted for stock-based compensation expense, amortization of intangible assets, and accelerated depreciation related to certain property, plant and equipment items. Non-GAAP net loss is defined as GAAP net loss adjusted for stock-based compensation expense, amortization of intangible assets, accelerated depreciation related to certain property, plant and equipment items, legal reserve related to employee matters, transaction costs relating to acquisition activities, change in fair value of warrant liabilities, and provision for income taxes. Free Cash Flow is defined as operating cash flow less capital expenditures. We use “Order Book” as a metric to measure performance against anticipated achievement of planned key milestones of our business. Order Book is defined as the forward-looking cumulative billings estimate of Luminar’s hardware and software products over the lifetime of given vehicle production programs which Luminar’s technology is expected to be integrated into or provided for, based primarily on projected / actual contractual pricing terms and our good faith estimates of “take rate” of Luminar’s technology on vehicles. “Take rates” are the anticipated percentage of new vehicles to be equipped with Luminar’s technology based on a combination of original equipment manufacturer (“OEM”) product offering decisions and predicted end consumer purchasing decisions. We include programs in our Order Book when (a) we have obtained a written agreement (e.g. non-binding expression of interest arrangement or an agreement for non-recurring engineering project) or public announcement with a major industry player, and (b) we expect to ultimately be awarded a significant commercial program. We believe Order Book provides useful information to investors as a supplemental performance metric as our products are currently in a pre-production stage and therefore there are currently no billings or revenues from commercial grade product sales. OEMs customarily place non-cancelable purchase orders with their automotive component suppliers only shortly before or during production. Consequently, we use Order Book to inform investors about the progress of expected adoption of our technologies by OEMs because there is, in our view, no other better metric available at our stage. The Order Book estimate may be impacted by various factors, as described in “Risk Factors” in Item 1A of Part I of our Annual Report on Form 10-K for the fiscal year ended December 31, 2022 and subsequent filings with the Securities and Exchange Commission, including, but not limited to the following: (i) None of our customers make contractual commitments to use our lidar sensors and software until all test and validation activities have been completed, they have finalized plans for integrating our systems, have a positive expectation of the market demand for our features, and unrelated to us, have determined that their vehicle is ready for market and there is appropriate consumer demand. Consequently, there is no assurance or guarantee that any of our customers, including any programs which we included in our Order Book estimates will ever complete such testing and validation or enter into a definitive volume production agreement with us or that we will receive any billings or revenues forecasted in connection with such programs; (ii) The development cycles of our products with new customers vary widely depending on the application, market, customer and the complexity of the product. In the automotive market, for example, this development cycle can be as long as seven or more years. Variability in development cycles make it difficult to reliably estimate the pricing, volume or timing of purchases of our products by our customers; (iii) Customers cancel or postpone implementation of our technology; (iv) We may not be able to integrate our technology successfully into a larger system with other sensing modalities; and (v) The product or vehicle model that is expected to include our lidar products may be unsuccessful, including for reasons unrelated to our technology. These risks and uncertainties may cause our future actual sales to be materially different than that implied by the Order Book metric.